

Metrics
You can build custom charts using the following metrics:Average Order Value
Average Order Value
The average amount of money each customer spends per transaction; calculated by dividing the total revenue received by the total number of orders processed.
Transaction Count
Transaction Count
The total number of attempted transactions processed.
Transaction Value
Transaction Value
The total value of all attempted transactions processed.
Approval Rate
Approval Rate
The percentage of transactions processed that were ultimately approved; calculated by dividing the total number of approved transactions by the total number of attempted transactions.Charts for this metric include a View Attempted Transactions toggle; click it to view your approval rate in context of the total attempted transaction count.
Approved Transaction Count
Approved Transaction Count
The total number of approved transactions.
Approved Transaction Value
Approved Transaction Value
The total value of all approved transactions.
Decline Rate
Decline Rate
The percentage of total attempted transactions that were ultimately declined; calculated by dividing the total number of declines by the total number of attempted transactions.Charts for this metric include a View Declined Transaction Count toggle; click it to view your decline rate in context of the total declined transaction count.
Declined Transaction Count
Declined Transaction Count
The total number of declined transactions.
Declined Transaction Value
Declined Transaction Value
The total value of all declined transactions.
Chargeback Average Order Value
Chargeback Average Order Value
The average order amount disputed by your customers.
Chargeback Rate
Chargeback Rate
The percentage of attempted card transactions for which customers issued chargebacks in a given time period, calculated by dividing this month’s chargeback count by this month’s attempted transaction count.Charts for this metric include a View Chargeback Count toggle; click it to view your chargeback rate in context of the total chargeback count.
Chargeback Count
Chargeback Count
The total number of successful card-based chargebacks processed in a given time period.
Chargeback Value
Chargeback Value
The total combined value of all successful card-based chargebacks processed in a given time period.
Chargeback Win Rate
Chargeback Win Rate
The percentage of total card chargebacks won in a set time period; calculated by dividing the total number of chargebacks in the CHARGEBACKS_WON_DEFENDED status category by the total number of chargebacks received.
Dispute Rate
Dispute Rate
The percentage of non-card transactions for which customers issued disputes, calculated by dividing this month’s dispute count by this month’s transaction count.Charts for this metric include a View Dispute Count toggle; click it to view your non-card dispute rate in context of the total dispute count.
Dispute Count
Dispute Count
The total number of non-card transactions that customers filed a dispute for.
Dispute Value
Dispute Value
The total value of non-card transactions that customers filed a dispute for in a given time period.
Refund Rate
Refund Rate
The percentage of total transactions successfully refunded in a given time period; calculated by dividing the total number of refunds processed by the total number of transactions.Charts for this metric include a View Refund Count toggle; click it to view your refund rate in context of the total refund count.
Refund Count
Refund Count
The total number of successful refunds processed in a given time period.
Refund Value
Refund Value
The total combined value of all successful refunds processed in a given time period.
Settlement Count
Settlement Count
The total number of settled transaction events processed in a given time period.
Settlement Value
Settlement Value
The net value of all settled transaction events processed in a given time period.
Fee Amount
Fee Amount
The total amount of fees your business faced in a given time period, across all processors and fee categories.
Per-Transaction Fees
Per-Transaction Fees
The per-transaction fees your business faced in a given time period, across all fee categories.
Interchange Effective Rate
Interchange Effective Rate
The percentage of your total sales amount spent on interchange fees; calculated by dividing the total value of all fees with the
interchange fee type code by the total value of all approved transactions, unadjusted for chargebacks or refunds.Verification Approval Rate
Verification Approval Rate
The percentage of total verification attempts that succeeded in a given time period; calculated by dividing the total number of approved verifications by the total number of attempted verifications.Charts for this metric include a View Verification Count toggle; click it to view your verification approval rate in context of the total attempted verification count.
Verification Count
Verification Count
The total number of attempted verifications processed in a given time period.
Verification Value
Verification Value
The total combined value of all attempted verifications processed in a given time period.
Dimensions
The dimension you select determines how the chart breaks down the chosen metric. For example, if you choose Processor, the chart will show your metric broken down across each of your processors. Keep in mind, the metric determines the available dimensions. Choose from the following, organized into categories in the Dimensions drop-down menu:Data Connection
Data Connection
- Processor
- MID
- MCC (Chase only)
Payment Method
Payment Method
- BIN (Top 25)
- Card Brand
- Card Type
- Prepaid Reloadable Type
- Payment Method
- Network Tokens - Groups transactions by those processed with network tokens (true) vs. PANs (false); transactions that don’t include this data appear in the no_value_provided category
- Stored Credential
Settlements
Settlements
- Settlement Type
- Settlement Currency - The currency a transaction event settled in
Transaction
Transaction
- Presentment Currency - The currency a transaction was made in
- Transaction Status
- Transaction Response Code/Decline Code - The response code assigned to a transaction; all approved transactions appear under approved, while declines are broken down by decline code
- Raw Transaction Response Code - The full raw decline code and description exactly as it appears in the data ingested from your processor
- POS Entry Mode - The code identifying how a customer’s payment card information was captured
- Adyen Retry Attempt - Adyen retries some failed transaction attempts based on their own internal logic; Pagos only counts the final attempt of a retried Adyen transaction in your ingested data, tagging it with a custom flag indicating the total number of times Adyen attempted the transaction (e.g. initial_attempt, second_attempt, etc.)
- Installment Count - The number of installment payments selected for a given transaction (for payment methods with installment options)
- Network Advice - Guidance from the card network on why a transaction was declined and how to respond; keep in mind, not every network provides this data, and only Braintree and Adyen pass us the details
Dispute
Dispute
- Presentment Currency
- Dispute Reason - Reason for non-card dispute
- Dispute Status
- Rapid Dispute Resolution - Whether or not a disputed non-card transaction was resolved by Visa as Rapid Dispute Resolution
- Installment Count - The number of installments the disputed non-card transaction was paid in (for payment methods with installment options)
Chargebacks
Chargebacks
- Presentment Currency - The currency of a disputed transaction
- Chargeback Reason
- Chargeback Status
- Rapid Dispute Resolution - Whether or not a disputed transaction was resolved by Visa as Rapid Dispute Resolution
- Installment Count - The number of installments the disputed transaction was paid in (for payment methods with installment options)
Customer
Customer
- Customer Country
- Customer Region
- Track Device Data
Card Product
Card Product
- Card Product Name
- Card Product Category
Issuer
Issuer
- Issuing Bank (Top 25)
- Issuing Country
- Issuing Region
- Durbin Regulated - Whether or not the card used in the transaction was issued by a Durbin-regulated bank
- Fintech Brand - The fintech, neobank, BNPL, or wallet card program a card’s BIN belongs to (e.g. Chime, Cash App, Nubank), matched on the most specific known BIN prefix (8 digits where available, else 6).
- Fintech Category - The kind of fintech card program the card’s BIN belongs to (e.g. neobank, BNPL, prepaid, earned-wage access, crypto)
- Fintech Confidence - How specifically Pagos can identify the fintech program behind a card’s BIN. Possible values:
- Named - We know the fintech brand and its sponsor bank
- Sponsor - We only know the banking-as-a-service sponsor bank, not the fintech brand
- No Value Provided - The BIN isn’t in our fintech list
- Fintech Sponsor Bank - The banking-as-a-service sponsor bank that issues the fintech card program, when the BIN issuer is a known sponsor bank.
CVV/AVS
CVV/AVS
3D Secure
3D Secure
- 3DS Authentication Result
- 3D Secure Code
- 3D Secure Version - The version of 3DS used to process transactions; transactions that don’t include 3DS version information appear in the no_value_provided category
- Adyen 3D Secure Type
Refund
Refund
- Presentment Currency - The currency the original transaction was made in
- Refund Reason - Indicates the refund reason, if provided
- Refund Status
- Installment Count - The number of installments the original transaction was paid in (for payment methods with installment options)
Fees
Fees
- Fee Type
- Fee Category
- Fee Subcategory
- Settlement Currency - The currency a transaction event settled in
Custom Dimensions
Custom Dimensions
If you’ve worked with your Pagos Account Manager to build out custom dimensions, each option appears listed here.
Views
The View you select determines the style of chart created. If you make a chart for a count or value metric (e.g. approved transaction count or refund value), you can select from the following Views:- Across Time - Stacked bar chart with time on the x-axis; the dimension’s parameters make up each small bar within a stack
- By Share - Pie chart with the dimension’s parameters making up each wedge
- As Totals - Bar chart with the dimension on the x-axis; the dimension’s parameters each have their own bar
- Table - A table demonstrating your chosen metric broken down across the dimension’s parameters; see Tables for further customization options
You can’t choose a View in the following instances:
- Selecting a rate metric (e.g. approval rate) generates a line graph with time on the x-axis and the rate percentage on the y-axis.
- Selecting BIN (Top 25) or Issuing Bank (Top 25) as the dimension generates a table.
Tables
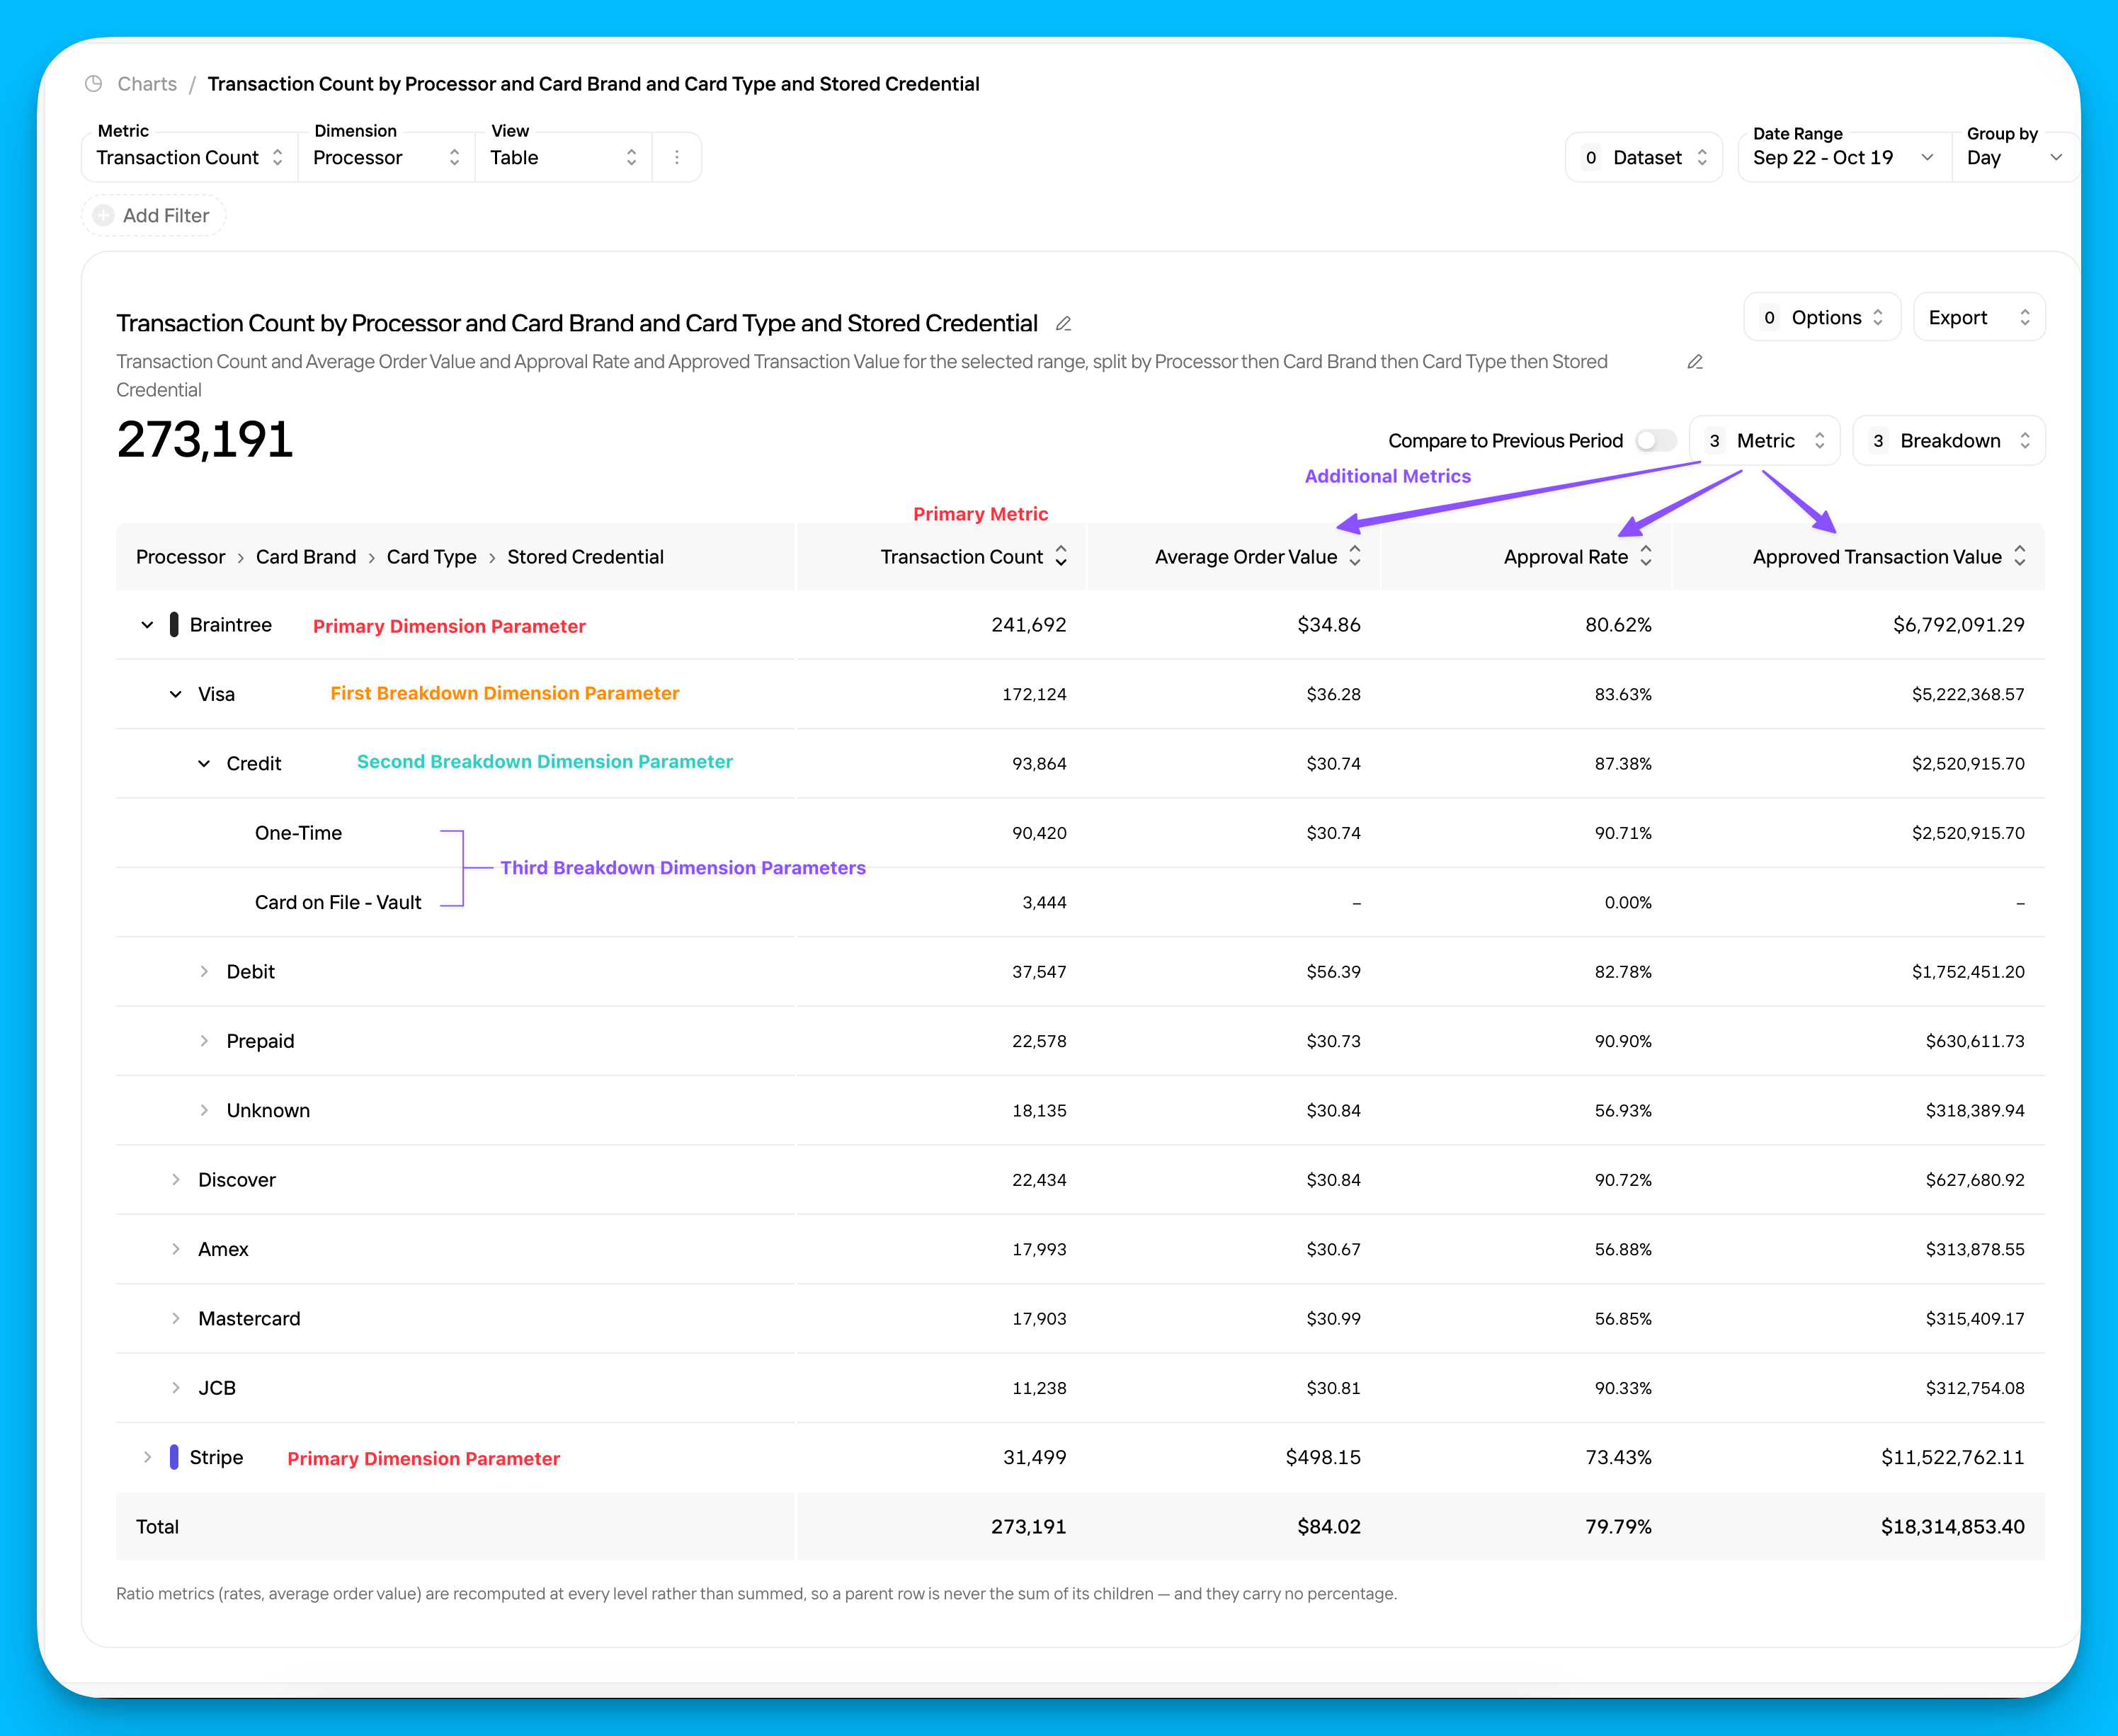
By default, a custom Table includes a row for each parameter of the chosen Dimension, and one column for your chosen Metric. You can further customize the table with additional metrics and dimension breakdowns. To add more metric columns, click Metric in the top-right corner of the table, then select up to three metrics from the drop-down menu. Click a metric again to remove it from the table. To further break down your data by more dimensions, click Breakdown, then select your first dimension from the drop-down menu. A > icon will appear on each row in the table; click this icon to expand additional rows subdividing your data by this new dimension. Select another dimension from the same menu to further subdivide your data. You can select up to three breakdown dimensions.Expand for a visual demonstration
Expand for a visual demonstration
Options
Depending on the Metric and View you selected, you will see an Options drop-down in the top-right corner of your chart. Click this menu to reveal the following toggles:- View Distribution - Adjust the chart to show the percent distribution of your data across the chosen dimension’s parameters. This option isn’t available for charts demonstrating a rate Metric or those with the By Share View.
- Frame Relevant Range - Zoom in on the relevant range of values on the y-axis; this is especially valuable when the lines of a chart are very close together. This option only appears for charts demonstrating rate Metrics.
- Original Transaction Dates - This option only appears for charts demonstrating a chargeback or refund Metric. View chargebacks or refunds issued against transactions originally processed in the selected date range. When selected, the metric name adjusts to indicate this toggle was applied (e.g. Chargeback Rate becomes Chargeback Rate (Date of Transaction)).
-
Show Trend Line - Add a line demonstrating a statistical trend over the selected date range.
Trend Line Notes
- The Trend Line option is only available for charts with the Across Time View.
- It doesn’t appear in rate charts when the associated count toggle is on (e.g. in an Approval Rate chart with the View Attempted Transactions toggle turned on), or in charts with a secondary Breakdown.
- Trend lines exclude the most recent time interval (e.g. this week when viewing a weekly date range, or the last two days for daily intervals), as your data for that time is still coming in and could skew the trend.
- Show Annotations - Add saved Annotations to the chart.
Lock Your Chart
By locking a custom chart, other users within your Pagos Organization can view the chart without fear of making changes to the settings or filters. To lock a chart, click the … icon beside the View drop-down menu, then click Lock Chart. Follow these same steps to unlock the chart.You can only lock charts you created from scratch.
- Favorite/unfavorite the chart
- Change the chart’s location within the Charts landing page or within a Collection
- Rename the Collection containing a locked chart
- Duplicate the locked chart to make a new version you can edit without restriction; we recommend editing the duplicate chart’s name for easy identification