How the Date Range filter works:
This page includes all unique transactions whose final attempt falls within the selected period, even if earlier attempts in that transaction’s retry sequence occurred before the chosen dates.If your selected date range includes today (e.g. Last 7 days), we treat the latest attempt on record as the final attempt, since future retries haven’t occurred yet. If you’re viewing a completed historical period (e.g. Jan 1-Jan 30, 2026), a transaction is only included if no further attempts were made after the period closes.
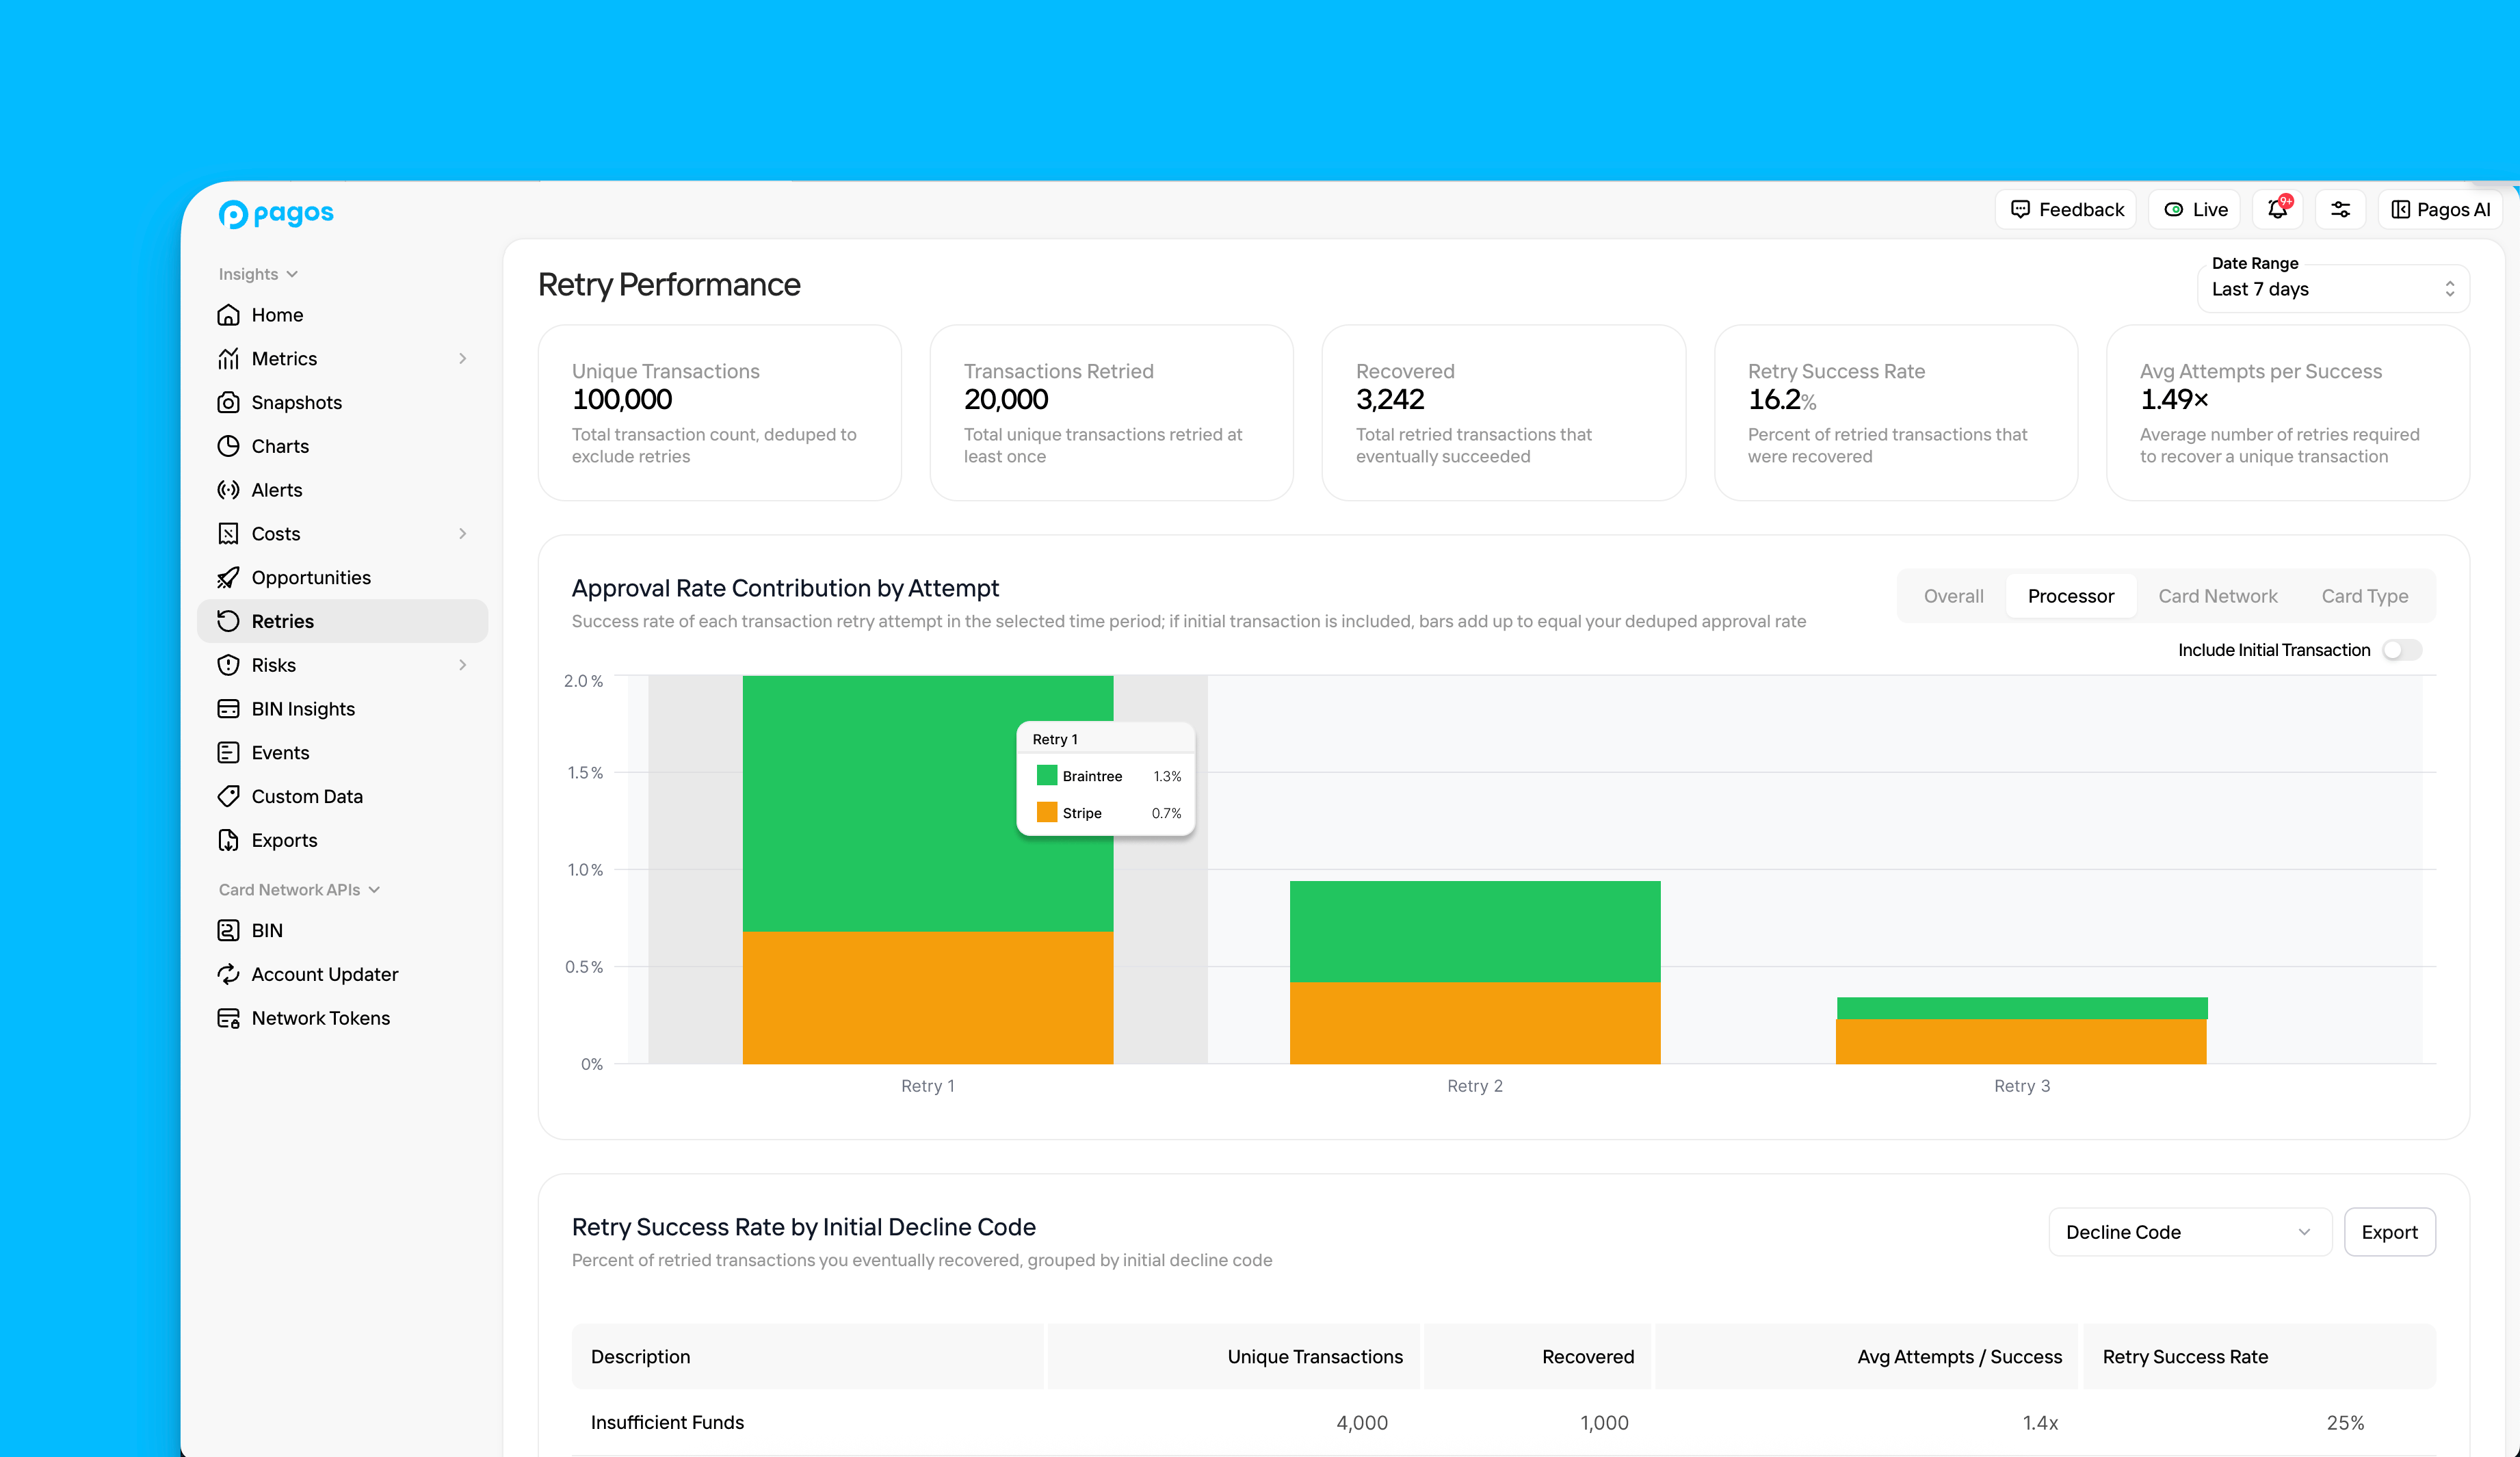
Retry Statistics
At the top of the page, you’ll find the following statistics around your retry strategy:- Unique Transactions - Your total transaction count, deduped to exclude identical transaction retries, for which the final attempt occurred in the selected time period
- Transactions Retried - The total number of unique transactions you retried at least once after the initial failed transaction attempt
- Recovered - The total number of unique transactions that eventually succeeded after at least one retry attempt
- Retry Success Rate - The percentage of all retried transactions that eventually succeeded after at least one retry attempt
- Avg Attempts per Success - The average number of retry attempts required before a failed transaction eventually succeeds
Approval Rate Contribution by Attempt
This graph demonstrates the percentage of total unique transactions recovered with each retry attempt in the selected time period. Each bar uses the Unique Transactions value from the Retry Statistics section as the denominator. For example, if you tried 100,000 Unique Transactions initially, and you recovered 2,000 on the first retry and 1,000 on the second retry, the Retry 1 bar would be 2% and the Retry 2 bar would be 1%. Use the toggle to add or remove the approval rate of the initial transaction attempt from the graph; when included, the rates shown for each bar add up to equal your deduped approval rate from that same time period. Click a tab at the top-right of the graph to determine how we further break down the bar for each transaction attempt. The options are:- Processor
- Card Network
- Card Type
To create this graph, we look at the attributes associated with the final, successful transaction attempt. This helps you identify which transaction parameters are most likely to result in approval.
Retry Success Rate
This table breaks down your retry success rate by different attributes of your initial transaction attempts. Use this data to identify how likely certain transactions are to eventually succeed or which transactions are worth retrying.This chart doesn’t take into account changes made to your transaction routing or the customer’s payment method for subsequent transaction retry attempts.
- Decline Code - The decline code your processor assigned to the initial transaction attempt
- Card Type
- Card Network
- Issuing Country
- Issuing Bank (Top 25)
- BIN (Top 25)
- Processor