Favorite Charts
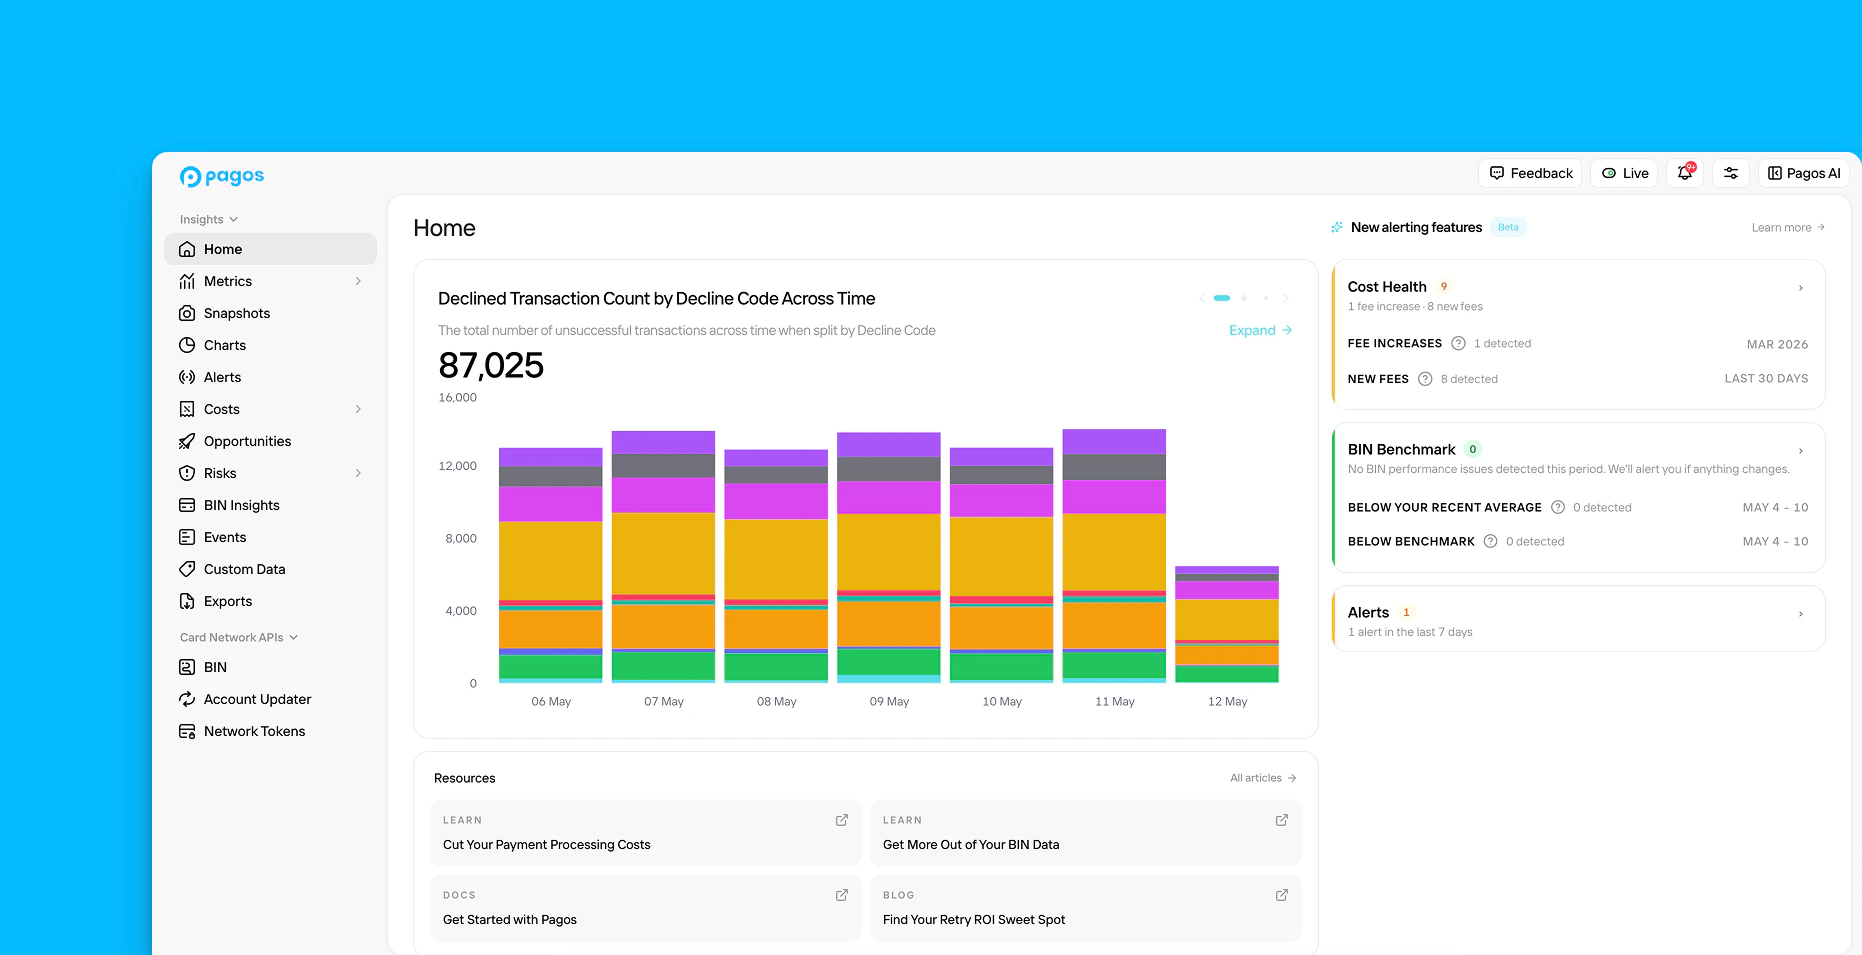
After you create and save a custom data visualization or Collection in the Charts section of Pagos Insights, you can click the star icon to favorite it. Your Favorites appear at the top of the main Charts page for easy access. These same Favorites also appear on the Home page, giving you immediate access to the data most important to your team. Use the navigational icons in the top right corner of the chart to scroll horizontally through each visual. Keep in mind, if you favorite a Collection, each individual chart in that Collection will appear on the Home page.Cost Health
Payment processing costs are complex and can be broken down by many fee type categories, subcategories, and codes. The Cost Health section of the Home page identifies the exact segments of your overall costs that require your attention. It’s broken into two sections: Fee Increases and New Fees.Fee Increases
Fee Increases identifies any anomalous increase of monthly fees in a single subcategory for one of your connected processors. This ensures you never miss an issue impacting one segment of your payment processing volume, even when such changes aren’t obvious in your total cost figures. On the 20th of every month, we automatically review your payment processing fees from the previous month, broken down by fee subcategory for each processor. If any fee subcategory-processor combination increases beyond established trends from the prior three months, it’ll appear under Cost Health along with the percentage fee increase month-over-month. Click the notification to navigate to the Fees by Subcategory dashboard, already filtered to the relevant processor and fee subcategory, where you can dig further into your fee data. Keep in mind the following:- Before Pagos can start analyzing your fee data for sudden increases, we must ingest at least three months of your cost data. Fee Increases will activate on the 20th of your fourth month with Pagos.
- We review your cost data for the previous month on the 20th of the current month (i.e. on March 20th, we review costs from February); this ensures we’ve ingested all cost data from last month before we analyze any cost changes.
- You’ll only receive a Fee Increase notification when both the fee amount and the ratio of fees to attempted transactions increases beyond historical norms. In other words, if fees increase proportionally with an increase in transaction volume, you won’t hear about it.
- We won’t review a fee subcategory-processor combination if the total fees for that processor are less than $5,000/month or total fees in the subcategory are less than $1,000.
This feature doesn’t account for:
- Fee adjustments
- Fees in the fee category of informational_data
- Unclassified fee types
- Volatile fees with inconsistent historical patterns
New Fees
New Fees identifies the newest payment processing fees you’ve faced in the last 30 days. These are the same fees surfaced by the New Fee toggle on the Fees and Interchange & Assessment Dashboards. Learn more about how we define new fees in the Costs guide.BIN Benchmark
The BIN Benchmark section of the Home page identifies the individual BINs that require your attention this week. It’s broken into two sections: Below Your Recent Average and Below Benchmark.Below Your Recent Average
This section identifies which of your BINS are performing below established trends in your own payments data. Every Wednesday, we review your data from the previous week (Monday-Sunday) and flag the top five BINs with the largest drop in approval rate when compared to the average approval rate of the prior three weeks. Click a BIN to view some of its basic data points, including card brand, card type, and issuer bank; click BIN Info to access all available data fields for that BIN in our BIN lookup tool. Alternatively, click View in Charts to open a custom Chart demonstrating that BIN’s approval rate over the last four weeks. From there, you can adjust the chart’s metric, dimension, and view to dig further into why this BIN’s approval rate has dipped. Keep in mind:- We only analyze BINs with over 100 attempted transactions in the last week.
- We only surface BINs for which the approval rate drop was at least 5%.
- When calculating the average approval rate from the previous 3 weeks, we use a weighted calculation that gives more weight to recent weeks.
Below Benchmark
Pagos Benchmarking looks at the billions of transaction data points we’ve ingested from our merchants and identifies mean approval rates per BIN for both merchant-initiated transactions (MITs) and customer-initiated transactions (CITs). Every Wednesday, we review your data from the previous week (Monday-Sunday) and flag the top five BINs in both categories where your approval rate gap below the Pagos benchmark has the greatest potential revenue impact. Click a BIN to view some of its basic data points, including its card brand, card type, and issuer bank; click BIN Info to navigate to our in-app BIN lookup tool, pre-populated with all available data fields for that BIN. Click View in Charts to open a custom Chart demonstrating that BIN’s approval rate over the last 14 days alongside the benchmark rate. Keep in mind the following:- For each BIN, we multiply your transaction count by the gap between your approval rate and the Pagos benchmark. This helps you spot where performance issues have the greatest potential revenue repercussions.
- We only surface BINs for which the approval rate difference was at least 5%.