

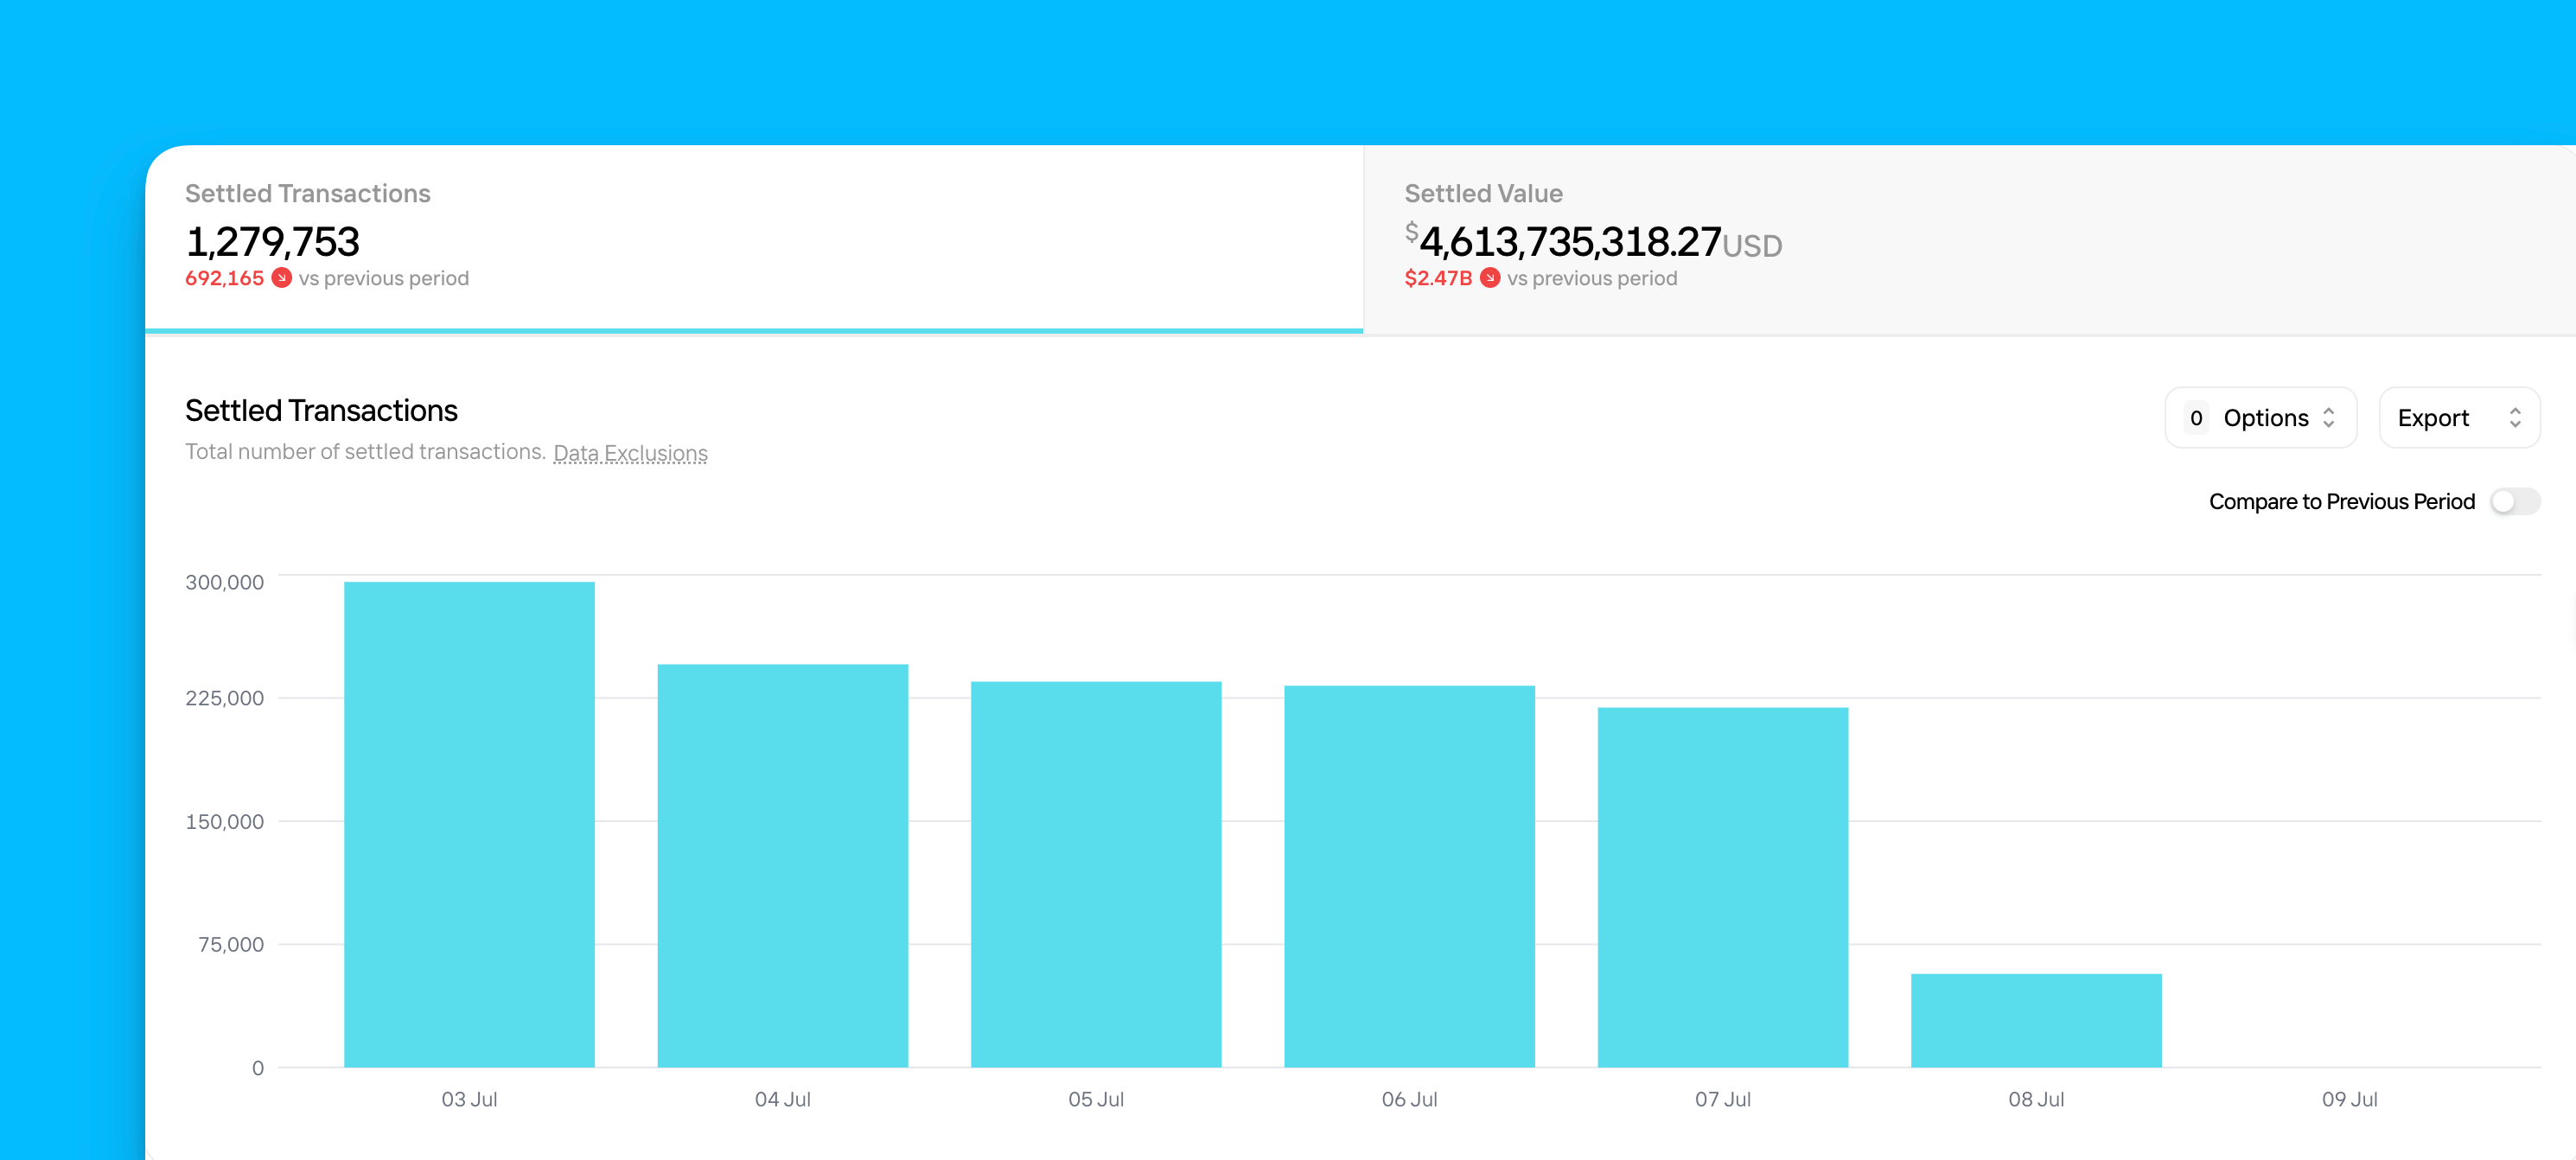
Navigating Settlements
To explore the Settlements Metrics pages:1
Navigate to Settlements
Click Metrics in the main navigation, then click Settlements.
2
Select a tab
Each tab represents a different metric relevant to your settlement data. Click a tab to view a graph of the associated metric over the last seven days. Your options include:
Settlement Count
Settlement Count
The total number of settled transaction events in a given time period
Settlement Value
Settlement Value
The total combined value of all settled transaction events in a given time period; this value is net and accounts for any refunded transaction amounts
3
Set a date range
Use the Date Range filter in the top-right corner of the page to change the time period.
4
Compare to previous period
Click the Compare to Previous Period toggle to view the value of that metric in the chosen time period side-by-side with that of the previous period, including the total or percent change in that value from one period to the next.
5
Apply additional settings to the chart
Click Options, then select from the following:
- View Distribution - Adjust the chart to show the percent distribution of your data across a set of parameters; this option only appears when using Focus mode
- Frame Relevant Range - Zoom in on the relevant range of values on the y-axis
- Show Trend Line - Add a line demonstrating a statistical trend over the selected date range.
Trend Line Notes
- The Trend Line option doesn’t appear when using Focus mode.
- Trend lines exclude the most recent time interval (e.g. this week when viewing a weekly date range, or the last two days for daily intervals), as your data for that time is still coming in and could skew the trend.
6
7
Export your data
Click Export to select from the following options:
- Open With… - Select from the available options to continue your analysis in a different section of your Pagos Service Panel.
- Aggregated Data - Download the data displayed in the chart. If you’ve filtered or focused your data to any particular dimensions or parameters, these customizations will be reflected in the exported data.
- Transaction-Level Data - If you’re subscribed to Transaction-Level Data Exports, you can download the data for the individual transactions included in the chart. Downloaded charts will appear in your Exports page; keep in mind, each report download is subject to your pricing agreement.
Bar Lists
You can use bar lists on the Settlements page to identify how different segments of your business contribute to your settlements. Click on a parameter in any graph to filter all graphs on the page to only show transactions that fit the chosen parameter. The available bar lists include:- Settlement Type
- Processor
- Data Connection
- MID
- Payment Method
- Card Type
- Card Brand
- Stored Credential
- Customer Country
- Issuer Country
- BIN
- Issuer