Navigating Chargebacks
To explore the Chargebacks Metrics pages:1
Navigate to Chargebacks
Click Metrics in the main navigation, then click Chargebacks.
2
Select a tab
Each tab represents a different metric relevant to your card chargeback data. Click a tab to view a graph of the associated metric over the last seven days. Your options include:
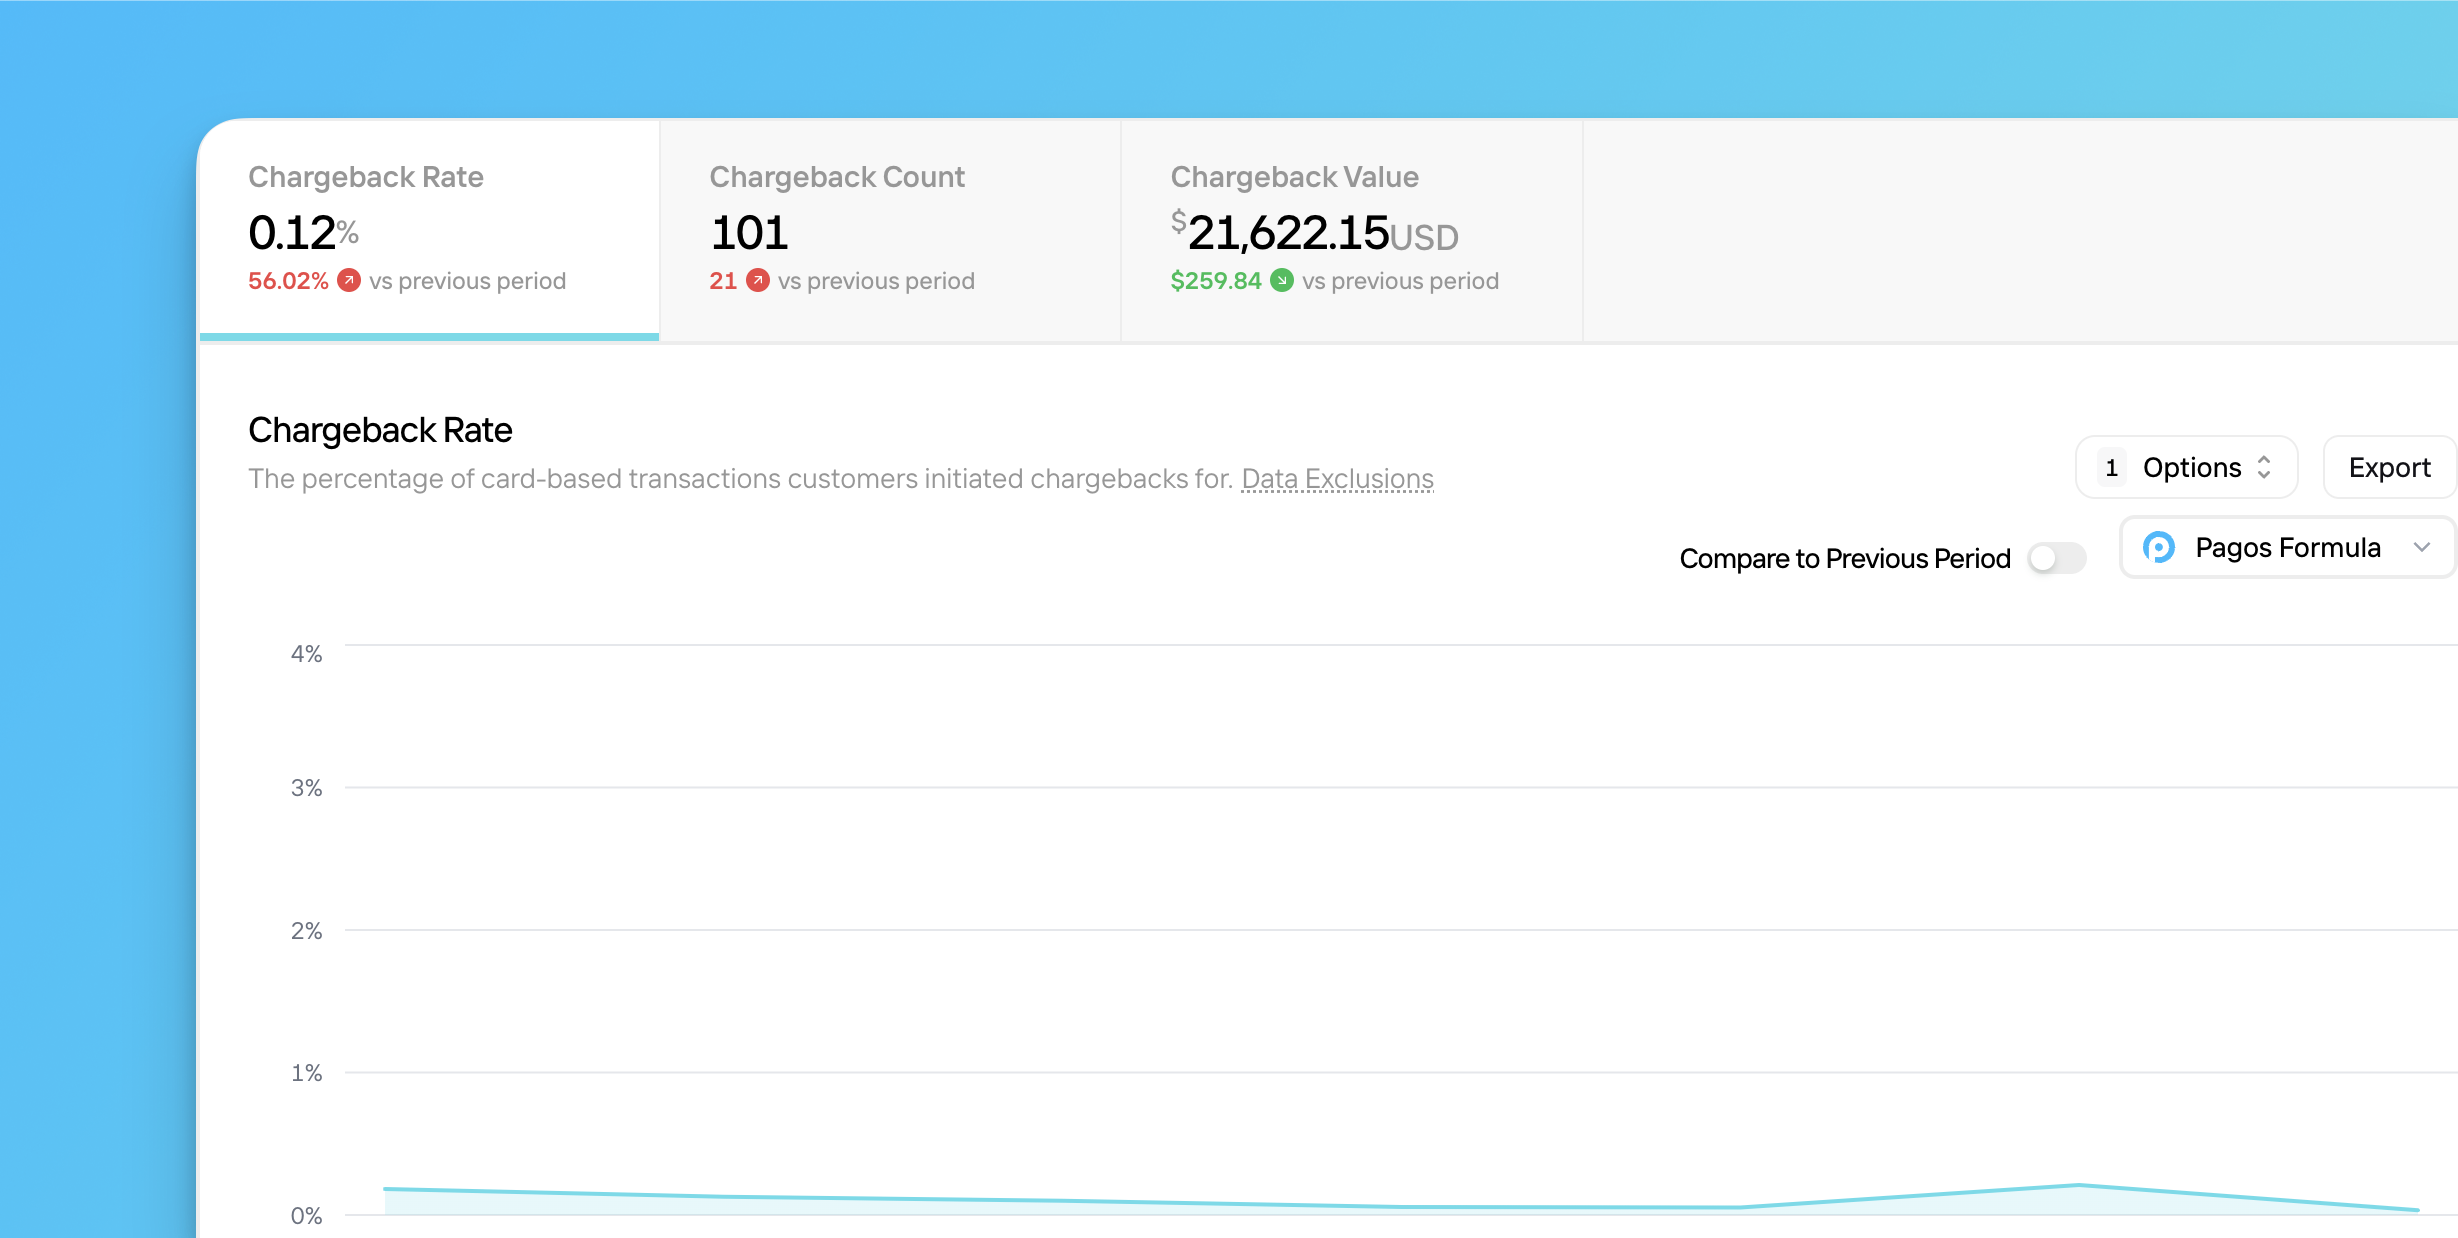
Chargeback Rate
Chargeback Rate
The percentage of total card-based transactions for which customers issued chargebacks in a given time period; use the chargeback formula drop-down menu to determine which formula we use to calculate chargeback rate; the bar lists in this tab show chargeback count
Chargeback Count
Chargeback Count
The total number of successful card-based chargebacks processed in a given time period
Chargeback Value
Chargeback Value
The total combined value of all successful card-based chargebacks processed in a given time period
3
Set a date range
Use the Date Range filter in the top-right corner of the page to change the time period.
4
Filter out specific transactions
Click Dataset, then select from the following options:
Pending Transaction
Pending Transaction
Click toggle to remove pending transactions from your data.
All Chargeback & Dispute Statuses
All Chargeback & Dispute Statuses
Click toggle to include chargebacks resolved by Visa as Rapid Dispute Resolution, and those with the status categories of cancelled, RFI, pre-arbitration, pre-dispute, notification_of_fraud, and pre-compliance
5
Compare to previous period
Click the Compare to Previous Period toggle to view the value of that metric in the chosen time period side-by-side with that of the previous period, including the total or percent change in that value from one period to the next.
6
Apply additional settings to the chart
Click Options, then select from the following (availability varies by metric):
- Frame Relevant Range - Zoom in on the relevant range of values on the y-axis
- View Distribution - Adjust the chart to show the percent distribution of your data across a set of parameters; this option only appears for count and value tabs when using Focus mode
- Show Trend Line - Add a line demonstrating a statistical trend over the selected date range
Trend Line Notes
- The Trend Line option doesn’t appear when using Focus mode.
- Trend lines exclude the most recent time interval (e.g. this week when viewing a weekly date range, or the last two days for daily intervals), as your data for that time is still coming in and could skew the trend.
7
Choose a chargeback formula
Click the chargeback formula drop-down to select which formula we use to calculate your chargeback rate:
Pagos Formula
Pagos Formula
This month’s chargeback count divided by this month’s transaction count for your entire transaction volume; when you choose Pagos Formula, the Chargeback page shows data for your entire transaction and chargeback volume
Visa Formula
Visa Formula
The Visa formula reflects the new Visa Acquirer Monitoring Program (VAMP) rate, which is calculated as the sum of all non-fraud chargebacks and early fraud warnings, divided by your settled card-not-present transaction count. When you choose Visa Formula, the Chargeback page only shows Visa transaction data.Learn more about VAMP in the section below.
Mastercard Formula
Mastercard Formula
This month’s chargeback count divided by last month’s transaction count for your Mastercard transaction volume; when you choose Mastercard Formula, the Chargeback page shows data for only those transactions and chargebacks made with Mastercard cards
8
9
Export your data
Click Export to select from the following options:
- Open With… - Select from the available options to continue your analysis in a different section of your Pagos Service Panel.
- Aggregated Data - Download the data displayed in the chart. If you’ve filtered or focused your data to any particular dimensions or parameters, these customizations will be reflected in the exported data.
- Transaction-Level Data - If you’re subscribed to Transaction-Level Data Exports, you can download the data for the individual transactions included in the chart. Downloaded charts will appear in your Exports page; keep in mind, each report download is subject to your pricing agreement.
Visa Chargeback Formula and VAMP Data
When you select the Visa Formula, the main graph in each tab automatically breaks down your Fraud Notification (TC40) vs. Chargeback (TC15) contributions to your chargeback volume. The table beneath calculates your chargeback rate, chargeback count, and transaction count for each MID; this directly mirrors Visa’s VAMP calculation methods and helps you identify exactly what’s driving your VAMP rate across MIDs and processors. Click a MID in the table to remove it from the chart.VAMP Overview
Visa’s Acquirer Monitoring Program (VAMP) helps Visa monitor card-not-present fraud and chargeback risk across the ecosystem. Visa calculates a VAMP rate for each of your MIDs monthly, flagging accounts that exceed specific thresholds based on region and volume. If a MID’s VAMP rate is too high, you may face additional monitoring, potential penalties, or enforcement actions. The VAMP rate is calculated as the sum of all fraud and non-fraud chargebacks (identified in your TC15 report) and early fraud warnings (TC40 report), divided by your total settled card-not-present transaction count.Your VAMP rate may be different from your traditional chargeback rate, as Visa includes TC40 fraud alert data in their calculation. This provides a broader view of potential fraud exposure beyond what is captured in chargebacks alone.
Bar Lists
You can use bar lists on the Chargebacks page to identify how different segments of your business are impacted by chargebacks. Click on a parameter in any graph to filter all graphs on the page to only show transactions that fit the chosen parameter. The available bar lists include:- Chargeback Reason
- Chargeback Status
- Processor
- Data Connection
- MID
- Payment Method
- Card Type
- Card Brand
- Stored Credential
- Customer Country
- Issuer Country
- BIN
- Issuer