Applying Filters
Select filter parameters
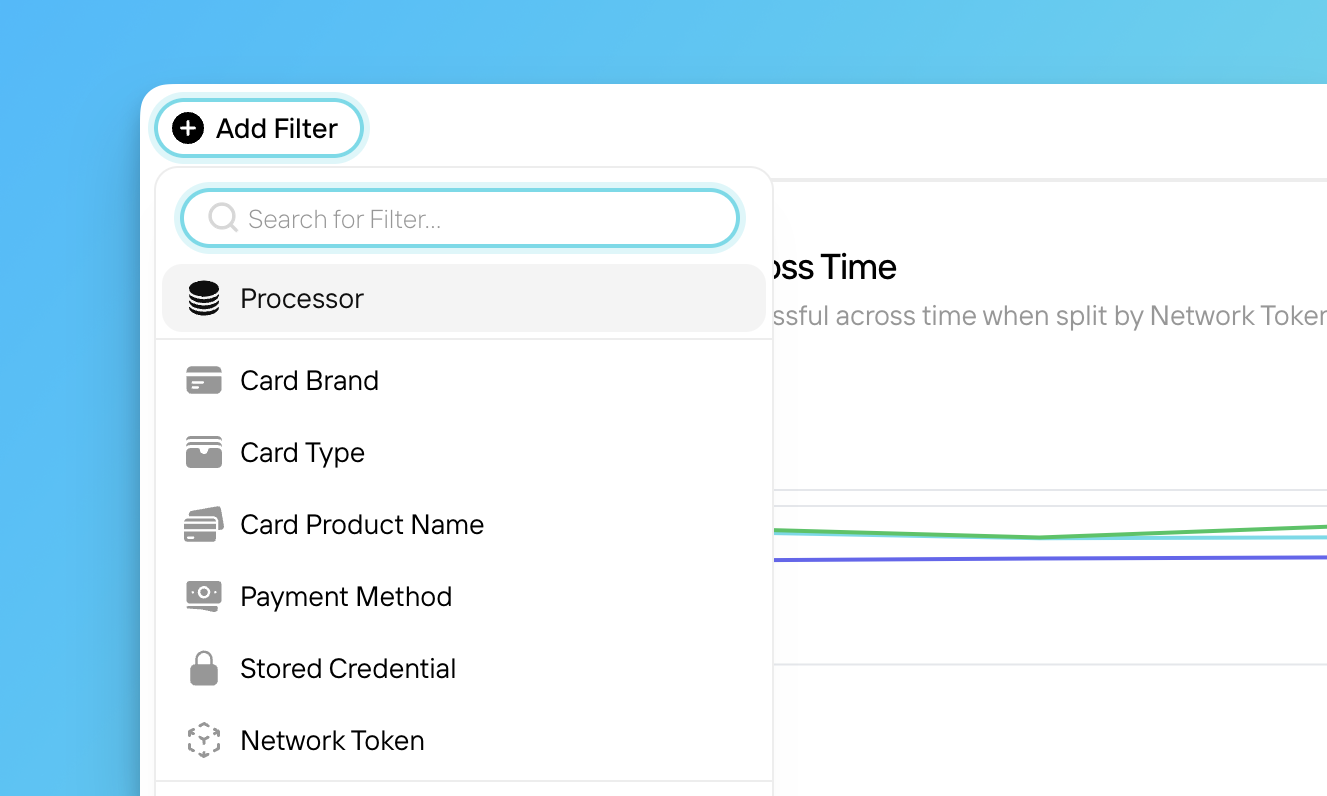
Click a filter in the drop-down menu, select your preferred filter parameters, then click Apply Filters.
Filter Options
Depending on the page or section of Insights you’re in, you may see any of the following filter options:Date Range
Date Range
Set a date range, along with a time interval to break the data down by (hourly, daily, weekly, monthly, quarterly, or yearly). Keep in mind, hourly data for a date range more than 3 months ago will have slow load times.
Processor
Processor
View data for transactions processed through the selected data connections; you can filter down to the Processor, Data Source Name, or even the Merchant Account ID level. If you’ve assigned aliases to your Merchant Account IDs, those alias names will appear in the filter menu.
Card Brand
Card Brand
View data for transactions made using payment cards from the selected card brands.
Card Type
Card Type
View data for transactions made with the selected payment card types (e.g. credit, debit, prepaid).
Card Product
Card Product
View data for transactions made with the selected card product.
Payment Method Type
Payment Method Type
View data for transactions made with the selected payment methods (e.g. amazon_pay, android_pay, apple_pay, card, google_pay, PayPal wallet, sepa, klarna, and ideal).
Stored Credential
Stored Credential
View data for the selected transaction types, identified by their use of stored payment credentials (e.g. one-time, recurring, installment).
Network Token
Network Token
View data for transactions made with customer primary account numbers (PANs) or network tokens.
Transaction Status
Transaction Status
View data for transactions with the selected status at the time indicated in the Date Range filter.
Transaction Response Code
Transaction Response Code
View data for transactions with the selected issuer response codes (e.g. do_not_honor, expired_card, decline_gateway, etc.).
Transaction Size
Transaction Size
View data for transactions whose total value was greater than, less than, or between the indicated amount(s) in USD; for transactions processed in other currencies, view data for transactions whose total value converts to the filtered USD amount.
Deduplication
Deduplication
Remove duplicate transaction data (e.g. retries) from your visualizations. At this time, the retry deduplication filter doesn’t apply to duplicate retries processed through PayPal, dLocal, or Klarna.If you imported historical payments data into your Pagos account at signup, the retry deduplication filter may not apply to your historical data. Some processors don’t provide all the necessary details (e.g. BIN, last four digits, or expiration date) with historical data imports to meet the retry filter’s logic.
Issuing Bank
Issuing Bank
View data for transactions made using payment cards issued by the selected issuing banks.
Issuing Region
Issuing Region
View data for transactions made with cards issued in the selected regions.
Issuing Country
Issuing Country
View data for transactions made with cards issued in the selected countries.
Customer Region
Customer Region
View data for transactions made by customers located in the selected regions.
Customer Country
Customer Country
View data for transactions made by customers located in the selected countries.
Presentment Currency
Presentment Currency
View data for transactions processed in the selected presentment currencies.
BIN
BIN
View data for transactions made with payment cards with the selected bank identifier numbers (BINs).
CVV
CVV
View data for transactions with the selected CVV response codes.
AVS Line Code
AVS Line Code
View data for transactions with the selected AVS line codes.
AVS Post Code
AVS Post Code
View data for transactions with the selected AVS post codes.
Rapid Dispute Resolution
Rapid Dispute Resolution
View data for disputed transactions resolved by Visa as Rapid Dispute Resolution. Transactions from any other card brand will be categorized as No Value Provided.
Chargeback Status
Chargeback Status
View data only for disputed transactions with the selected chargeback status code.
Chargeback Reason
Chargeback Reason
View data only for disputed transactions with the selected chargeback reason code.
Adyen Retry Attempt
Adyen Retry Attempt
View data for Adyen transactions tagged with specific retry flags (Adyen retries some failed transaction attempts multiple times based on their own internal logic; when we pull your transaction data from Adyen, we only ingest the final attempt of a retried Adyen transaction, tagging it with a custom retry flag indicating the total number of times Adyen attempted the transaction).
Track Device Data
Track Device Data
View data for transactions the processor collected device data for or did not. At this time, this filter only applies to transactions processed through Braintree; transactions processed through other processors will be categorized under No Value Provided.
Soft Descriptor
Soft Descriptor
View data for transactions tagged with specific soft descriptors; if you’re unsure what soft descriptors you currently use, check out the Soft Descriptors tab in the Custom Data section of your Pagos account.
Metadata
Metadata
View data for transactions tagged with specific metadata. Click Metadata Name to select the metadata field, enter the metadata value, then click Add; if you’re unsure what metadata values you currently use, check out the Metadata tab in the Custom Data section of your Pagos account.
Fee Type
Fee Type
View cost data associated with specific fee types.
Fee Category
Fee Category
View cost data associated with specific fee categories.
Fee Subcategory
Fee Subcategory
View cost data associated with specific fee subcategories.
Fee Description
Fee Description
Use the text field to enter a specific raw fee name as it appears in your processor data. The field uses contains logic, meaning we’ll filter for all raw fee names containing the text you enter. Apply the filter, then export your Aggregated Data; the Fee Descriptions column identifies the exact raw fee names you filtered for.