Metrics
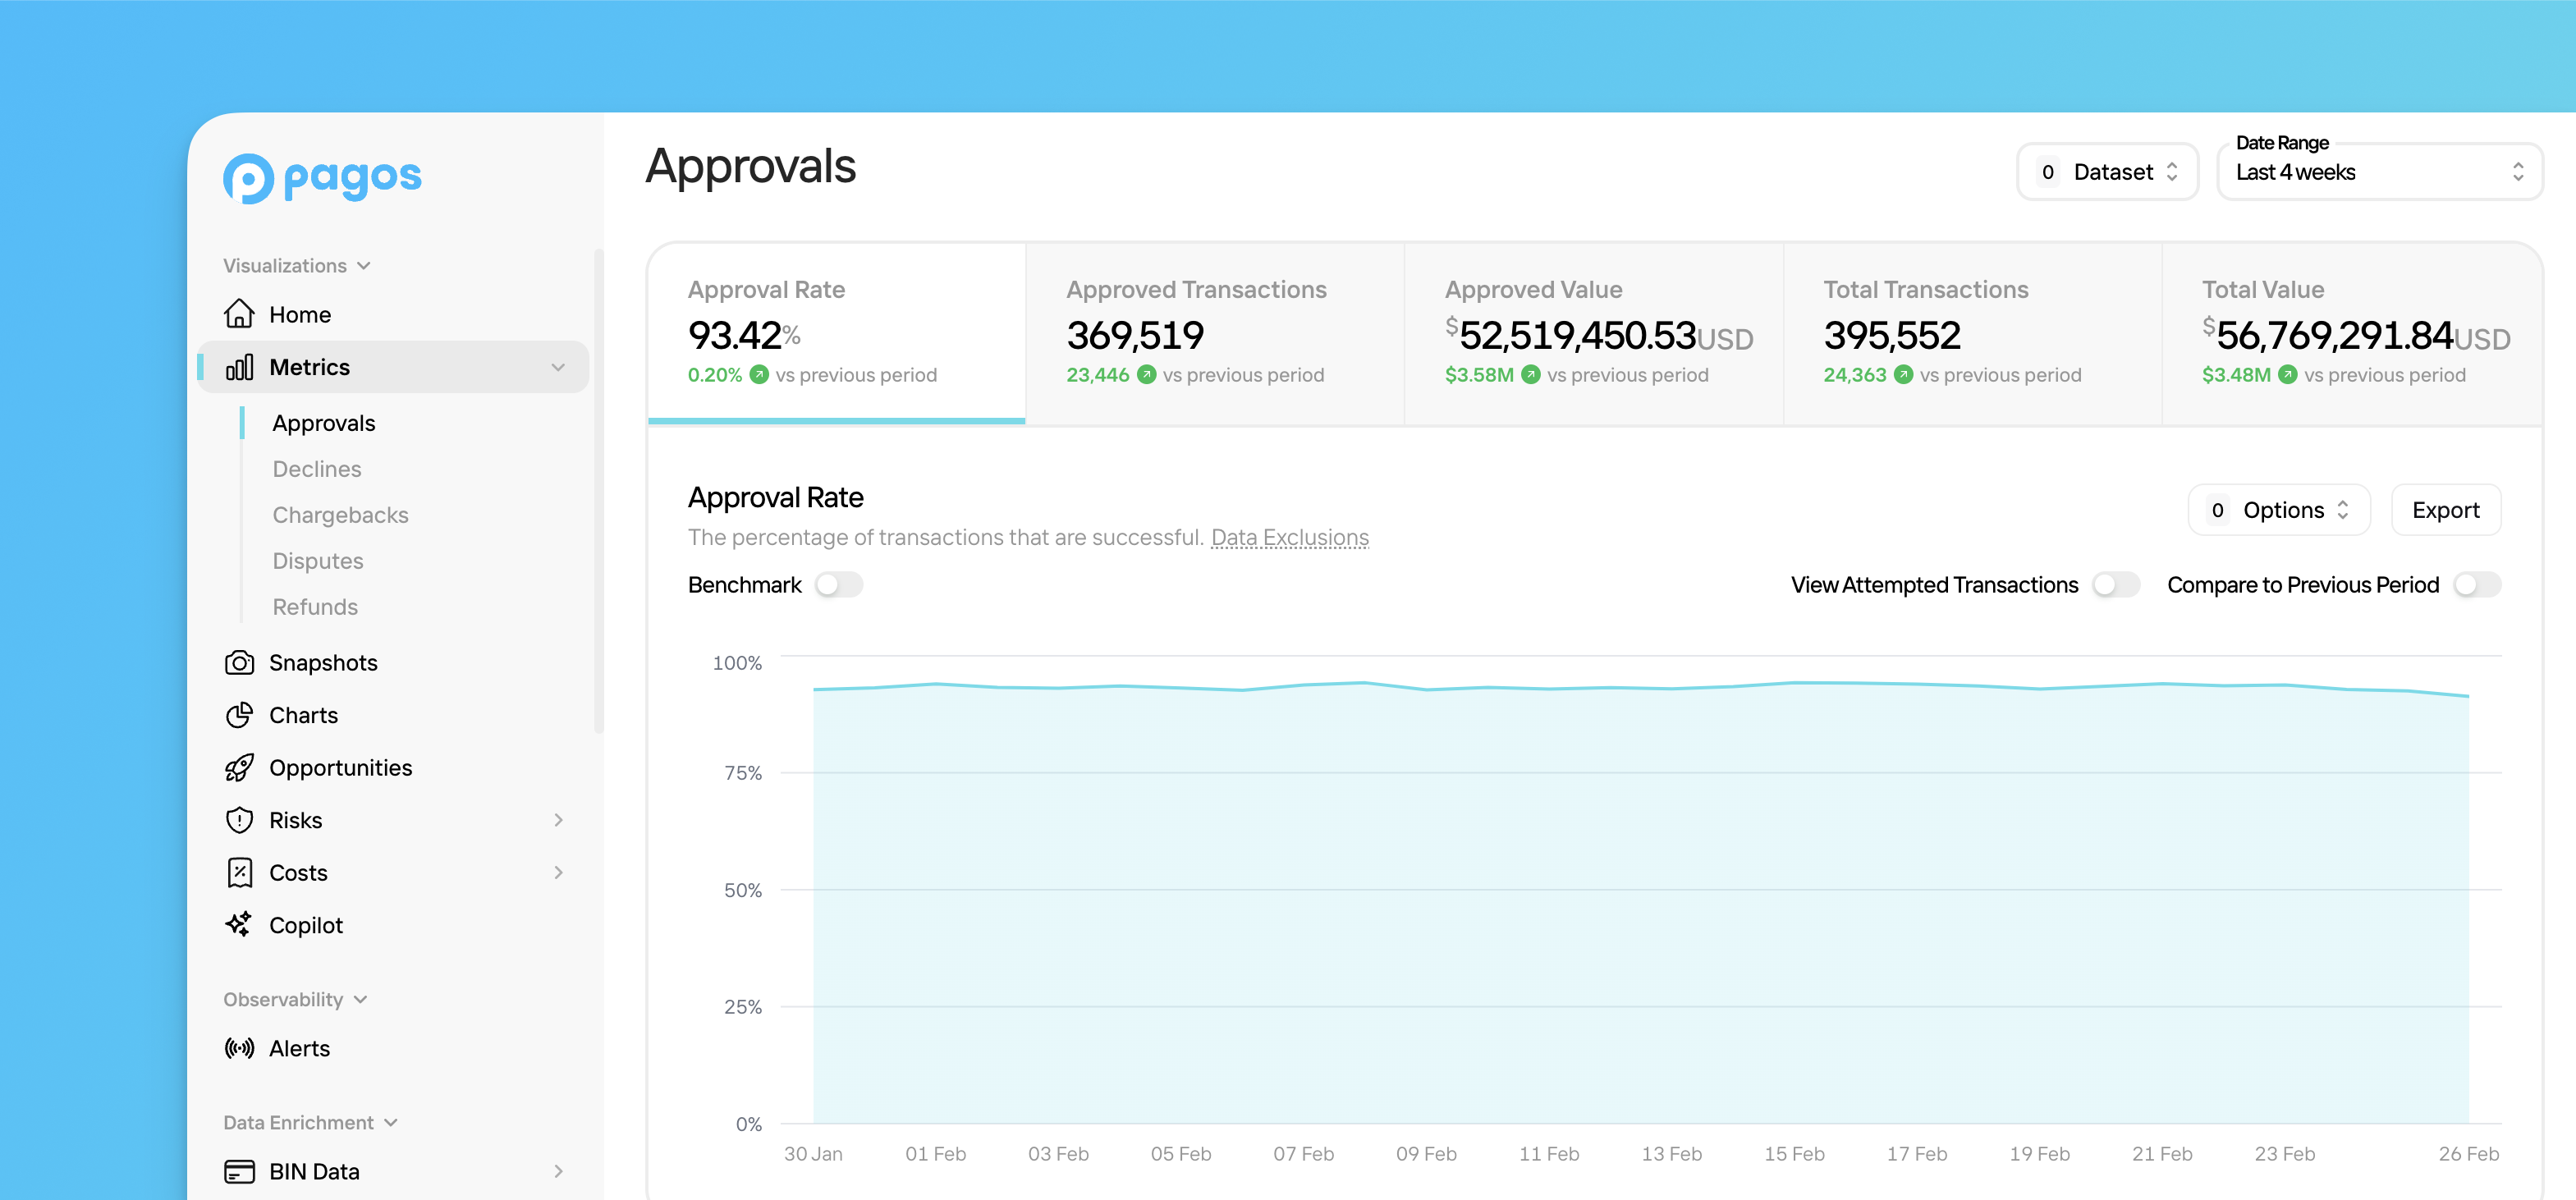
The Metrics section of your Peacock Service Panel provides a high-level view of the payment metrics we deem most important for any business. We present these metrics on the following pages:
Navigating the Metrics Pages
To explore the Metrics pages:
- Click Metrics in the main navigation, then click the desired Metrics page.
- Each page contains a main graph, broken into tabs for specific metrics. Click a tab to view a graph of the associated metric over the last seven days.
- Use the Date Range filter in the top-right corner of the page to change the time period.
- Click Dataset to filter out duplicate or pending transactions:
- Click the Deduplicate toggle to turn on this filter, then select the type of transactions you want to deduplicate; the options include Retries and any custom deduplication options you’ve set up.
- Click the Pending Transactions toggle to remove pending transactions from your data.
- Click the Compare to Previous Period toggle to view the value of that metric in the chosen time period side-by-side with that of the previous period, including the total or percent change in that value from one period to the next.
- Beneath the main graph, you’ll find a set of bar lists breaking down your data by different parameters, including Processor, Card Brand, BIN, and more.
- Click on any parameter to filter all the data on that page.
- Any bar list that contains more than five parameters (e.g. the BINs graph) will include a Show More button. Click this button to view a pop-up containing the measurements for up to 50 other parameters; use the search bar in the pop-up to find a specific parameter.
- Click Focus to make the main graph at the top of the page show your data broken down by the parameters of the selected bar list.
- Click Export to download the data behind the main chart. If you've filtered or focused your data to any particular dimensions or parameters, these customizations will be reflected in the exported data.
Approvals
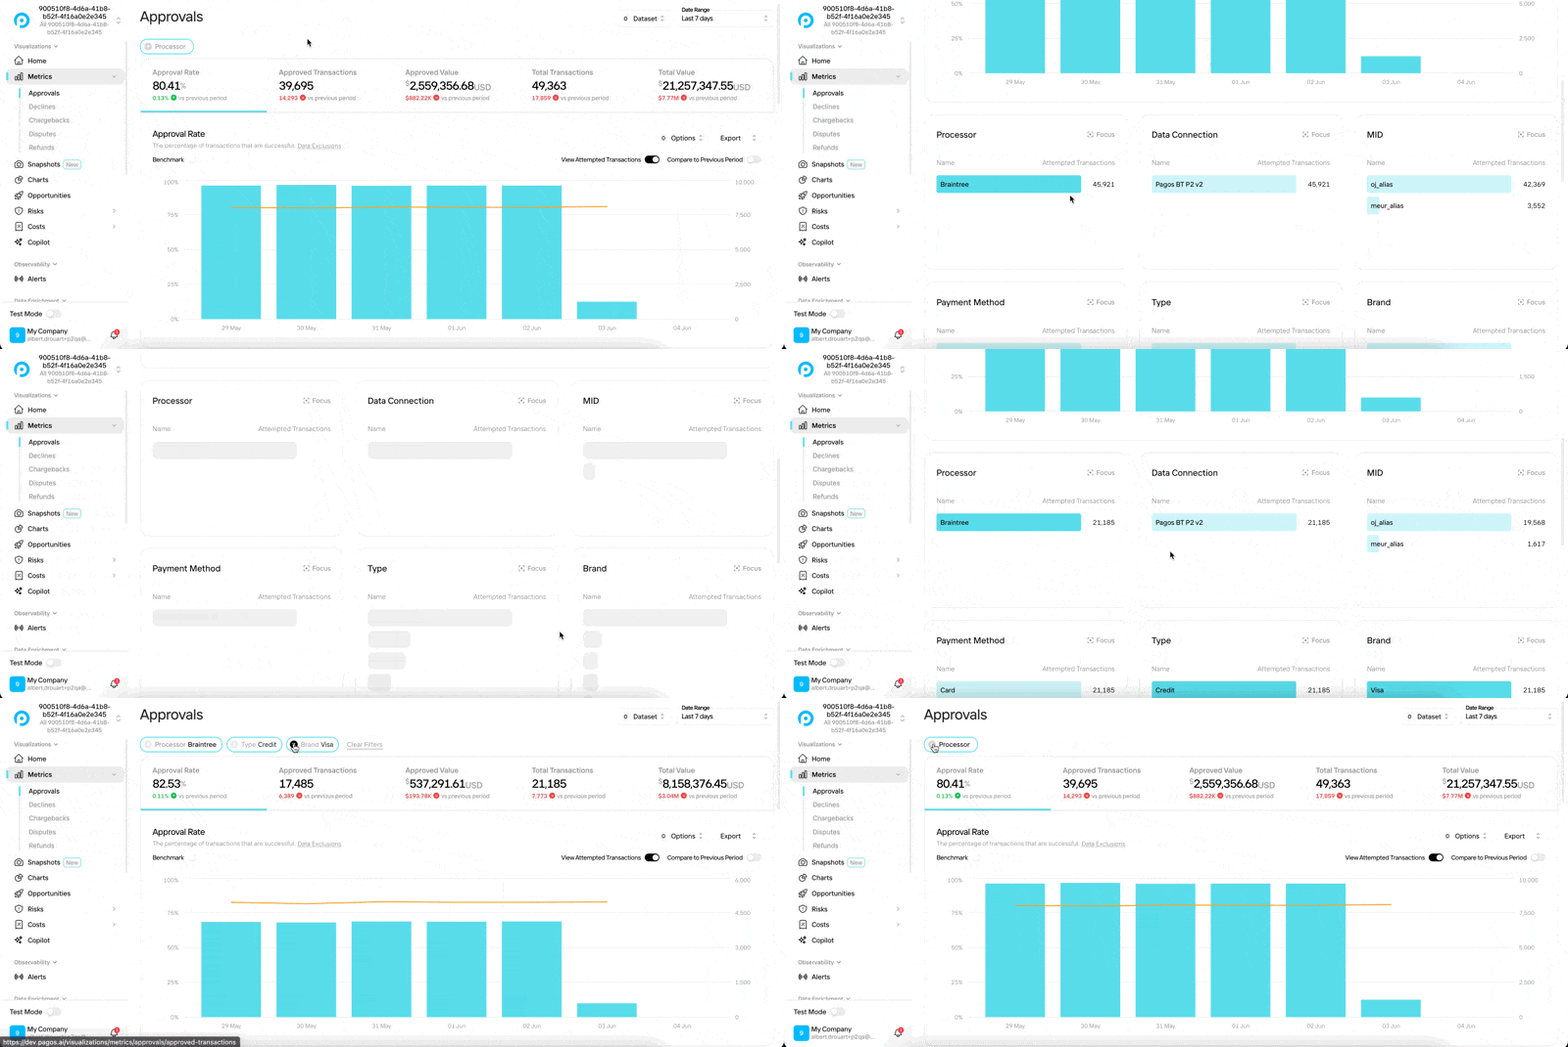
The main graph on the Approvals page contains tabs for the following metrics:
- Approval Rate - The percentage of transactions processed that were ultimately approved; calculated by dividing by the total number of approved transactions by the total number of attempted transactions within a given time period; the bar lists in this tab show attempted transaction count
- The View Attempted Transactions toggle is turned on by default to show your attempted transaction counts alongside your approval rate in the main graph. Click the toggle to remove this data from the visual.
- Approved Transactions - The total number of approved transactions in a given time period
- Approved Value - The total combined value of all approved transaction in a given time period
- Total Transactions - The total number of attempted transactions in a given time period
- Total Value - The total combined value of all attempted transactions in a given time period
The bar lists on this page show the tab's main metric broken down by various parameters. You can use these graphs to identify the segments of your transaction volume for which a change in approval rate would significantly impact your business. Click on a parameter in any graph to filter all graphs on the page to only show transactions that fit the chosen parameter.
Data Exclusions
The Approvals page only includes data for attempted and approved transactions. It doesn’t include verification or pending transaction data.
Declines
The main graph on the Declines page contains tabs for the following metrics:
- Decline Rate - The percentage of total attempted transactions declined; calculated by dividing the total number of declines by the total number of attempted transactions; the bar lists in this tab show declined transaction count
- Declined Transactions - The total number of declined transactions in a given time period
- Declined Value - The total combined value of all declined transactions in a given time period
The bar lists on this page show the tab's main metric broken down by various parameters. Click on a parameter in any graph to filter all graphs on the page to only show declined transaction volume that fits the chosen parameter(s). The Declines page contains additional bar lists titled Decline Code and Decline Category for filtering your data by specific decline codes and categories.
Chargebacks
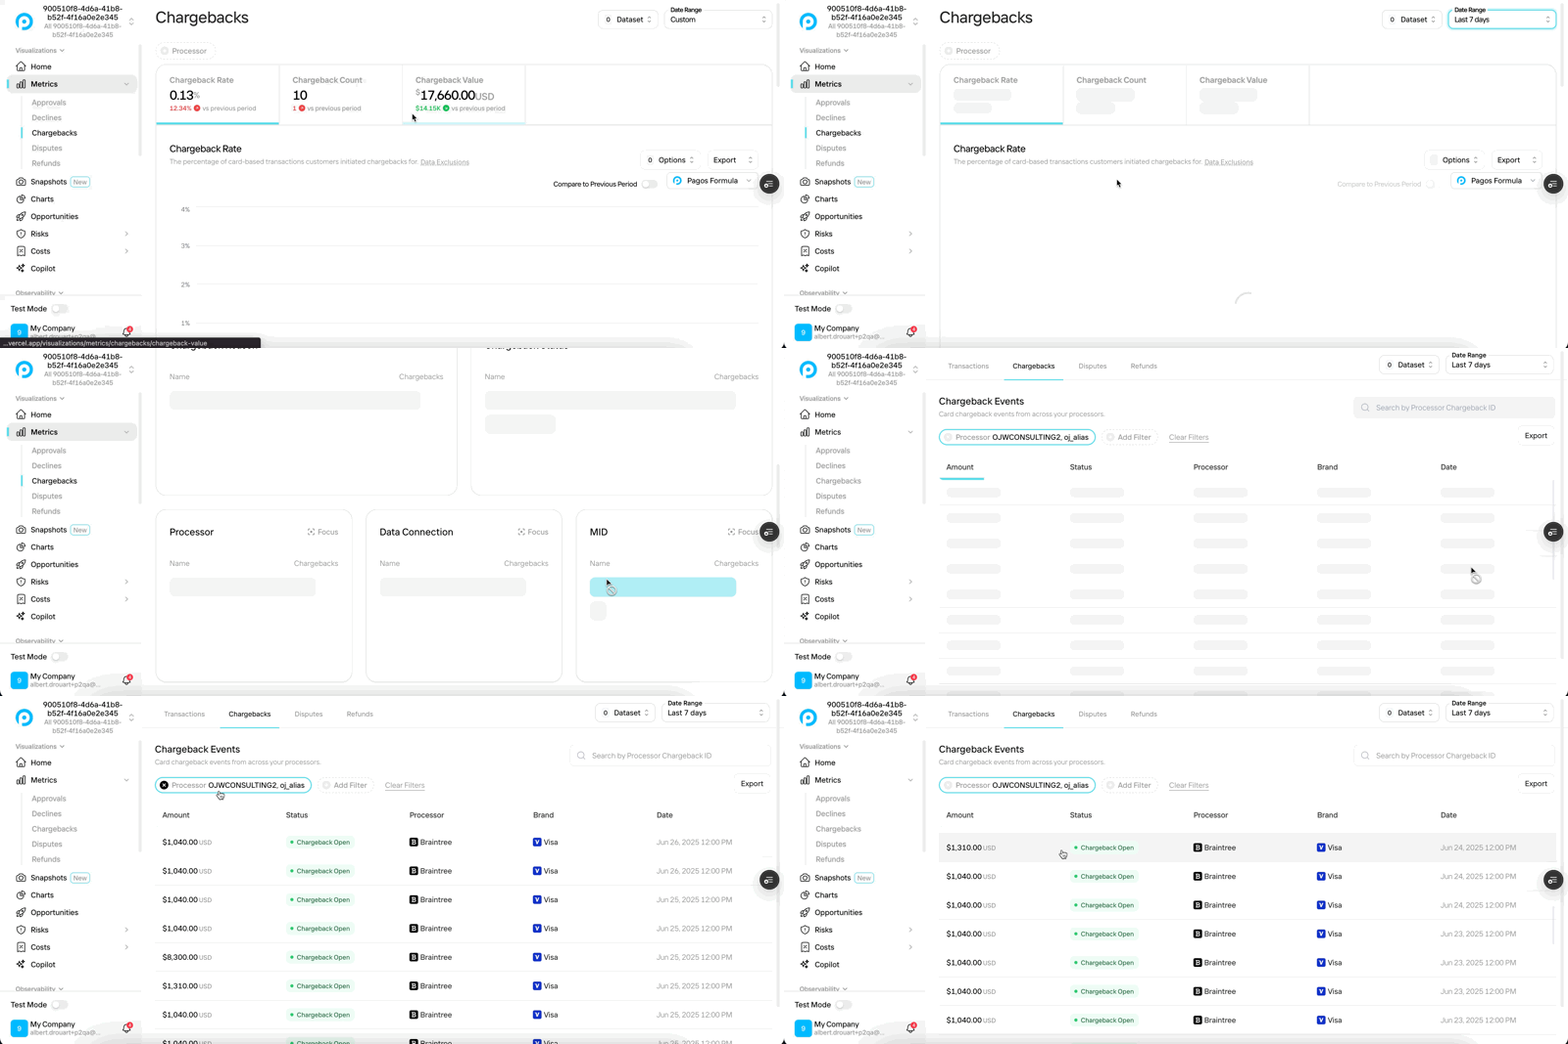
The main graph on the Chargebacks page contains tabs for the following metrics:
- Chargeback Rate - The percentage of total card-based transactions for which customers issued chargebacks in a given time period; use the chargeback formula drop-down menu to determine which formula we use to calculate chargeback rate; the bar lists in this tab show chargeback count
- Chargeback Count - The total number of successful card-based chargebacks processed in a given time period
- Chargeback Value - The total combined value of all successful card-based chargebacks processed in a given time period
The bar lists on this page show the tab's main metric broken down by various parameters. Click on a parameter in any graph to filter all graphs on the page to only show chargeback volume that fits the chosen parameter(s). The Chargebacks page contains additional bar lists titled Chargeback Reason and Chargeback Status for filtering your data by specific reasons or statuses.
Data Exclusions
The Chargebacks Metrics page excludes the following data:
- All non-card-based disputes
- SEPA chargebacks
- Chargebacks that result in rapid dispute resolution
- Chargebacks with the status categories of cancelled, RFI, pre-arbitration, pre-dispute, or notification_of_fraud.
Chargeback Formula
The chargeback formula drop-down is located in the top-right corner of the main graph on the Chargebacks Metrics page. Click the drop-down to select which formula we use to calculate the chargeback rate and present your data on the Chargeback page:
- Pagos Formula - This month's chargeback count divided by this month's transaction count for your entire transaction volume; when you choose Pagos Formula, the Chargeback page shows data for your entire transaction and chargeback volume
- Visa Formula - This month's chargeback count divided by this month's transaction count for your Visa transaction volume; when you choose Visa Formula, the Chargeback page shows data for only those transactions and chargebacks made with Visa cards
- Mastercard Formula - This month's chargeback count divided by last month's transaction count for your Mastercard transaction volume; when you choose Mastercard Formula, the Chargeback page shows data for only those transactions and chargebacks made with Mastercard cards
Disputes
The main graph on the Disputes page contains tabs for the following metrics:
- Dispute Rate - The percentage of non-card transactions for which customers issued disputes, calculated by dividing this month’s dispute count by this month's transaction count; the bar lists in this tab show the count of non-card disputes
- Dispute Count - The total number of non-card transactions that customers filed a dispute for in the given time period
- Dispute Value - The total value of non-card transactions that customers filed a dispute for in a given time period
The bar lists on this page show the tab's main metric broken down by various parameters. Click on a parameter in any graph to filter all graphs on the page to only show dispute volume that fits the chosen parameter(s). The Disputes page contains additional bar lists titled Dispute Reason and Dispute Status for filtering your data by specific reasons or statuses.
Data Exclusions
The Disputes Metrics page excludes the following data:
- All card-based chargebacks
- Card-funded PayPal transactions
- Disputes with the status categories of cancelled, RFI, pre-arbitration, pre-dispute, or notification_of_fraud.
Refunds
The main graph on the Refunds page contains tabs for the following metrics:
- Refund Rate - The percentage of total transactions successfully refunded in a given time period; calculated by dividing the total number of refunds processed by the total number of transactions; the bar lists in this tab show refund count
- Refund Count - The total number of successful refunds processed in a given time period
- Refund Value - The total combined value of all successful refunds processed in a given time period
The bar lists on this page show the tab's main metric broken down by various parameters. Click on a parameter in any graph to filter all graphs on the page to only show refunded transaction volume that fits the chosen parameter(s). The Refunds page contains additional graphs titled Refund Status for filtering this Metrics page for only those refunds with a specific status .
Filtering Metrics Pages
Filtering works differently in the Metrics pages than in the Peacock dashboards. To filter an entire Metrics page, click the desired parameter in the relevant bar list under the main graph. This will immediately filter all graphs across all tabs on this page to only show data for transactions that fit the chosen parameter.
For example, say you’re on the Approvals page and you see the attempted transaction count for each of the payment methods you accept in the Payment Method Type bar graph. If you click the bar for Card, this filters all graphs on the page—including the main graph—to show only transactions made with cards. The filter name and parameter appear at the top of the page to remind you what filter you’ve applied. The filter remains in place as you move between the tabs to change which metric appears in the main graph.
You can click a parameter in another bar list to dig even further into your data. Just keep in mind, you can’t filter by more than one parameter within the same category; for example, you can’t filter for transactions made with two different payment methods (e.g. card and PayPal).
Focus
Most bar lists in the Metrics pages have a Focus icon in the top right corner. When you click this icon, the main graph changes to show the tab's metric broken down by the parameters of that bar list. This provides you with the flexibility to break down metrics by whatever dimensions interest you. For example, clicking Focus on the Processors bar list in the Approval Rate tab, generates a line graph showing approval rate over time for each individual processor. Use the legend below the main graph to select or deselect parameters from the chosen focus dimension.
Updated 13 days ago