Chargebacks
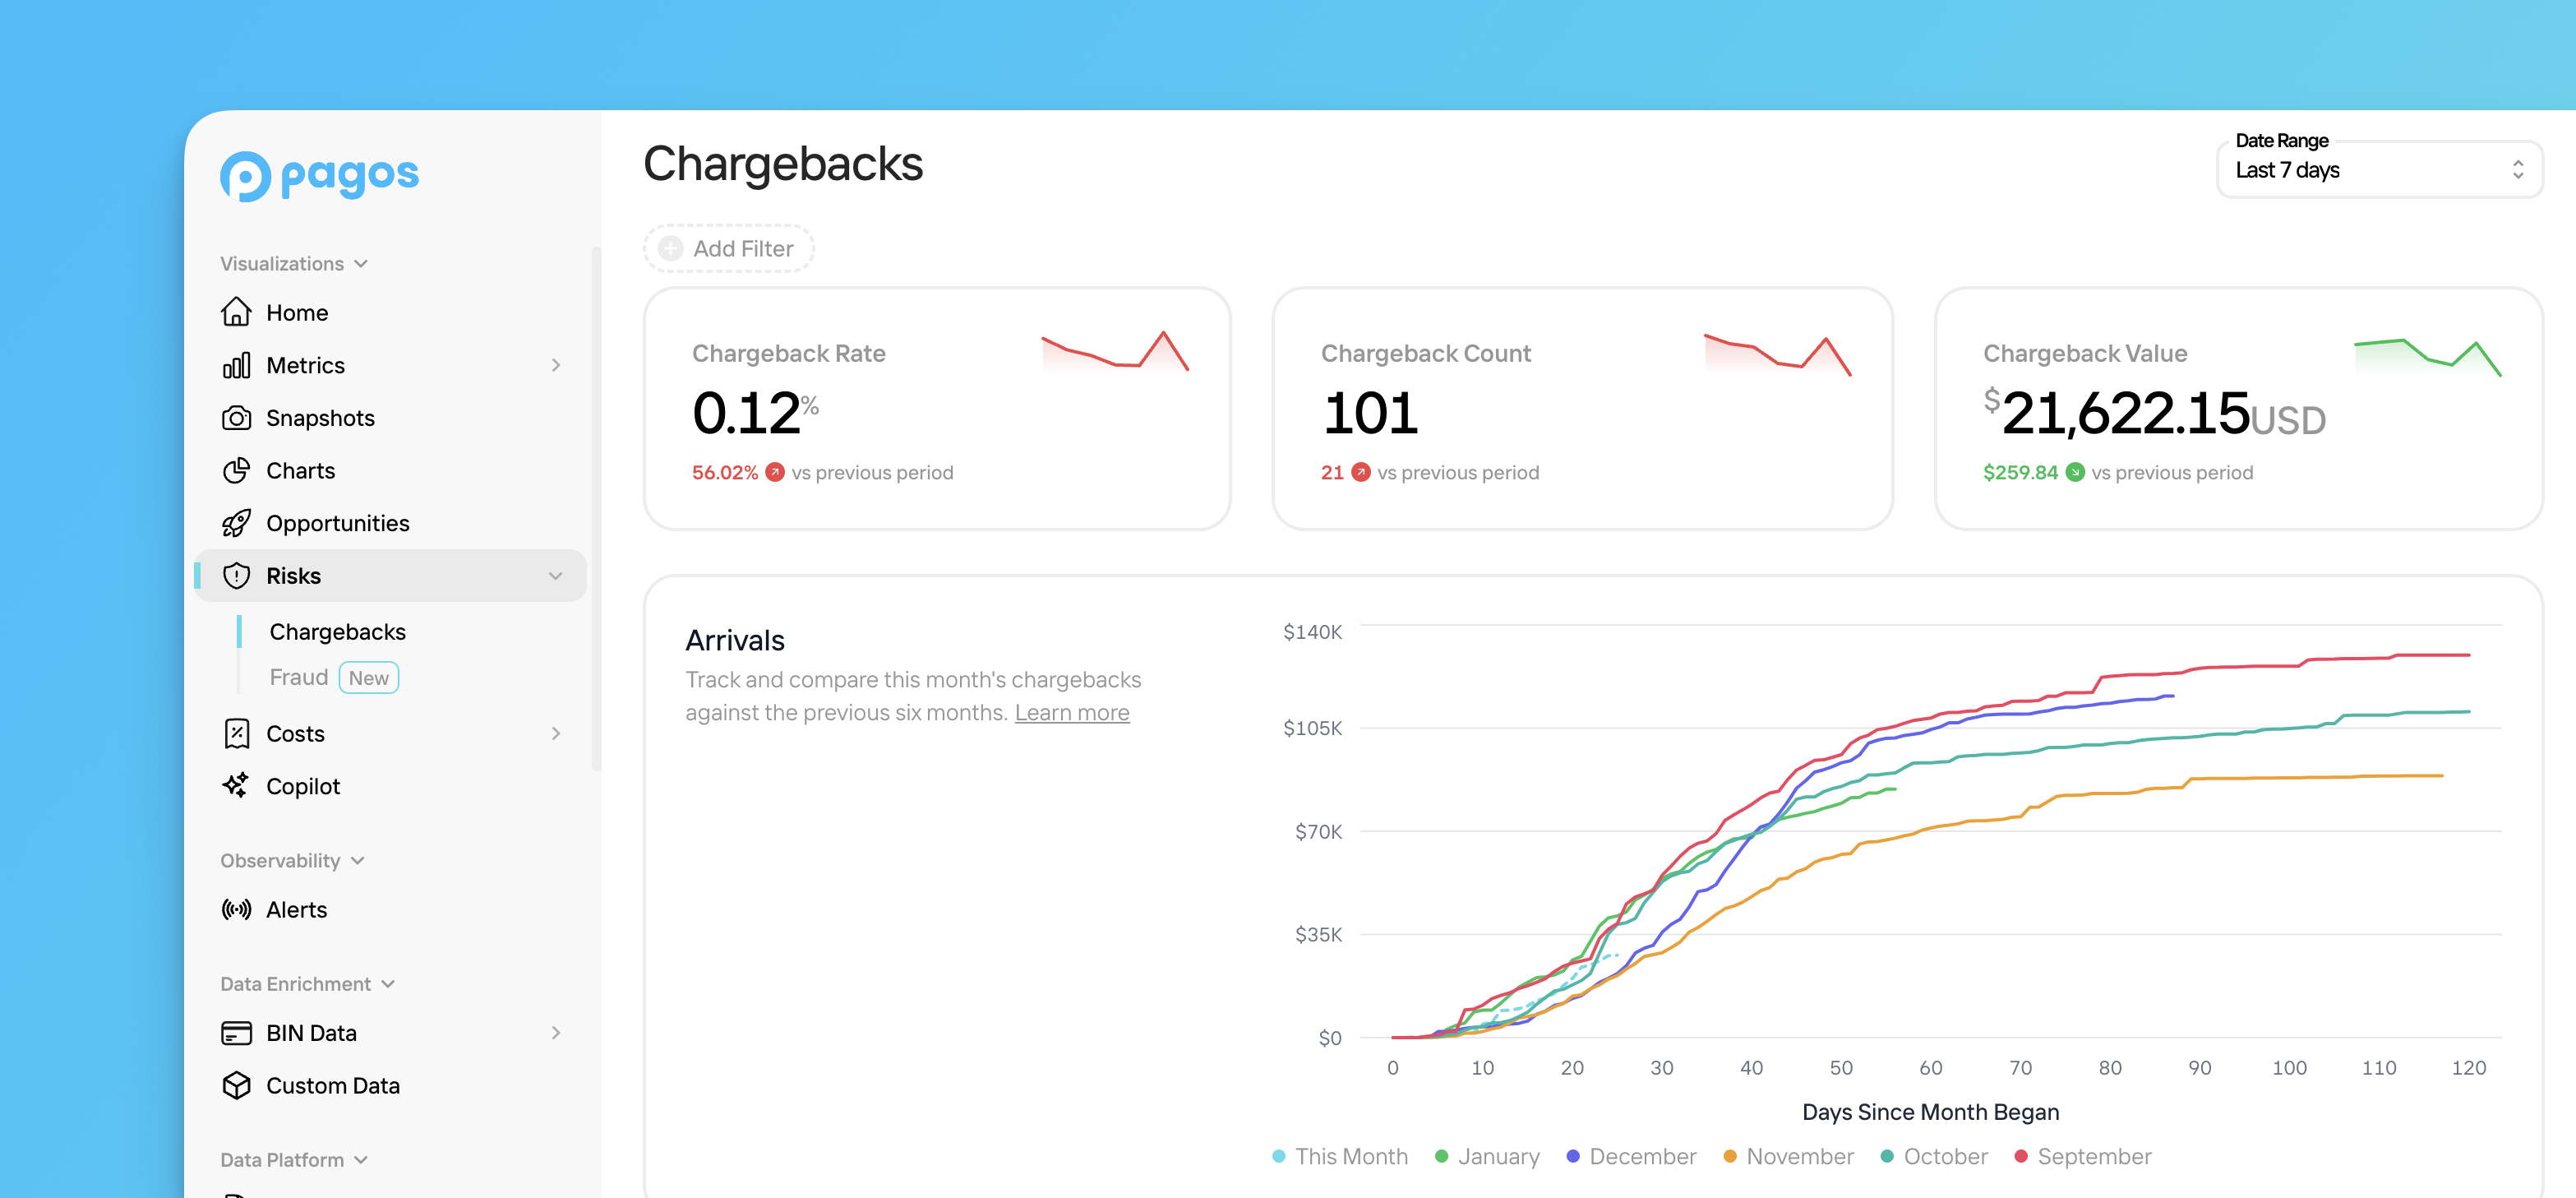
When you sell goods or services, you accept that some customers will inevitably issue chargebacks against their purchases. Whether these chargebacks are rooted in fraud, misunderstanding, or genuine concern over purchase quality, they can represent a risk to your business. Monitoring and identifying trends in chargeback volume is the first step towards minimizing their impact on both your revenue and total cost of payment acceptance. To explore the Chargebacks Risk page:- Click Risks in the main navigation, then click Chargebacks.
- Use the Date Range filter in the top-right corner of the page to change the time period. Click Add Filter to apply a data filter to the page.
- At the top of the page, you’ll find boxes containing your Chargeback Rate, Chargeback Count, and Chargeback Value for the chosen date range, along with a comparison to that of the previous period. Click a box to navigate to the corresponding tab in the Chargebacks Metrics page.
- Track and compare this month’s incoming chargebacks to that of the previous five months in the Arrivals chart.
- View the chargeback reason categories of the chargebacks your team has had the most success fighting in the Chargeback Win Rate By Reason Category chart. The table below provides additional context, breaking down your total chargeback counts and value by category and subcategory
Arrivals
The Arrivals chart uniquely demonstrates the rate at which your business receives chargebacks against transactions processed in a given month. Here’s how to read this chart:- The lines represent the month of the original transaction date. At this time, the chart shows 6 lines—one each for the current month and the prior five
- The X axis is the number of days since the start of the month; day 10, for example, corresponds to 10 days into a given month
- The Y axis is the combined value of all the chargebacks you’ve received in a given transaction month
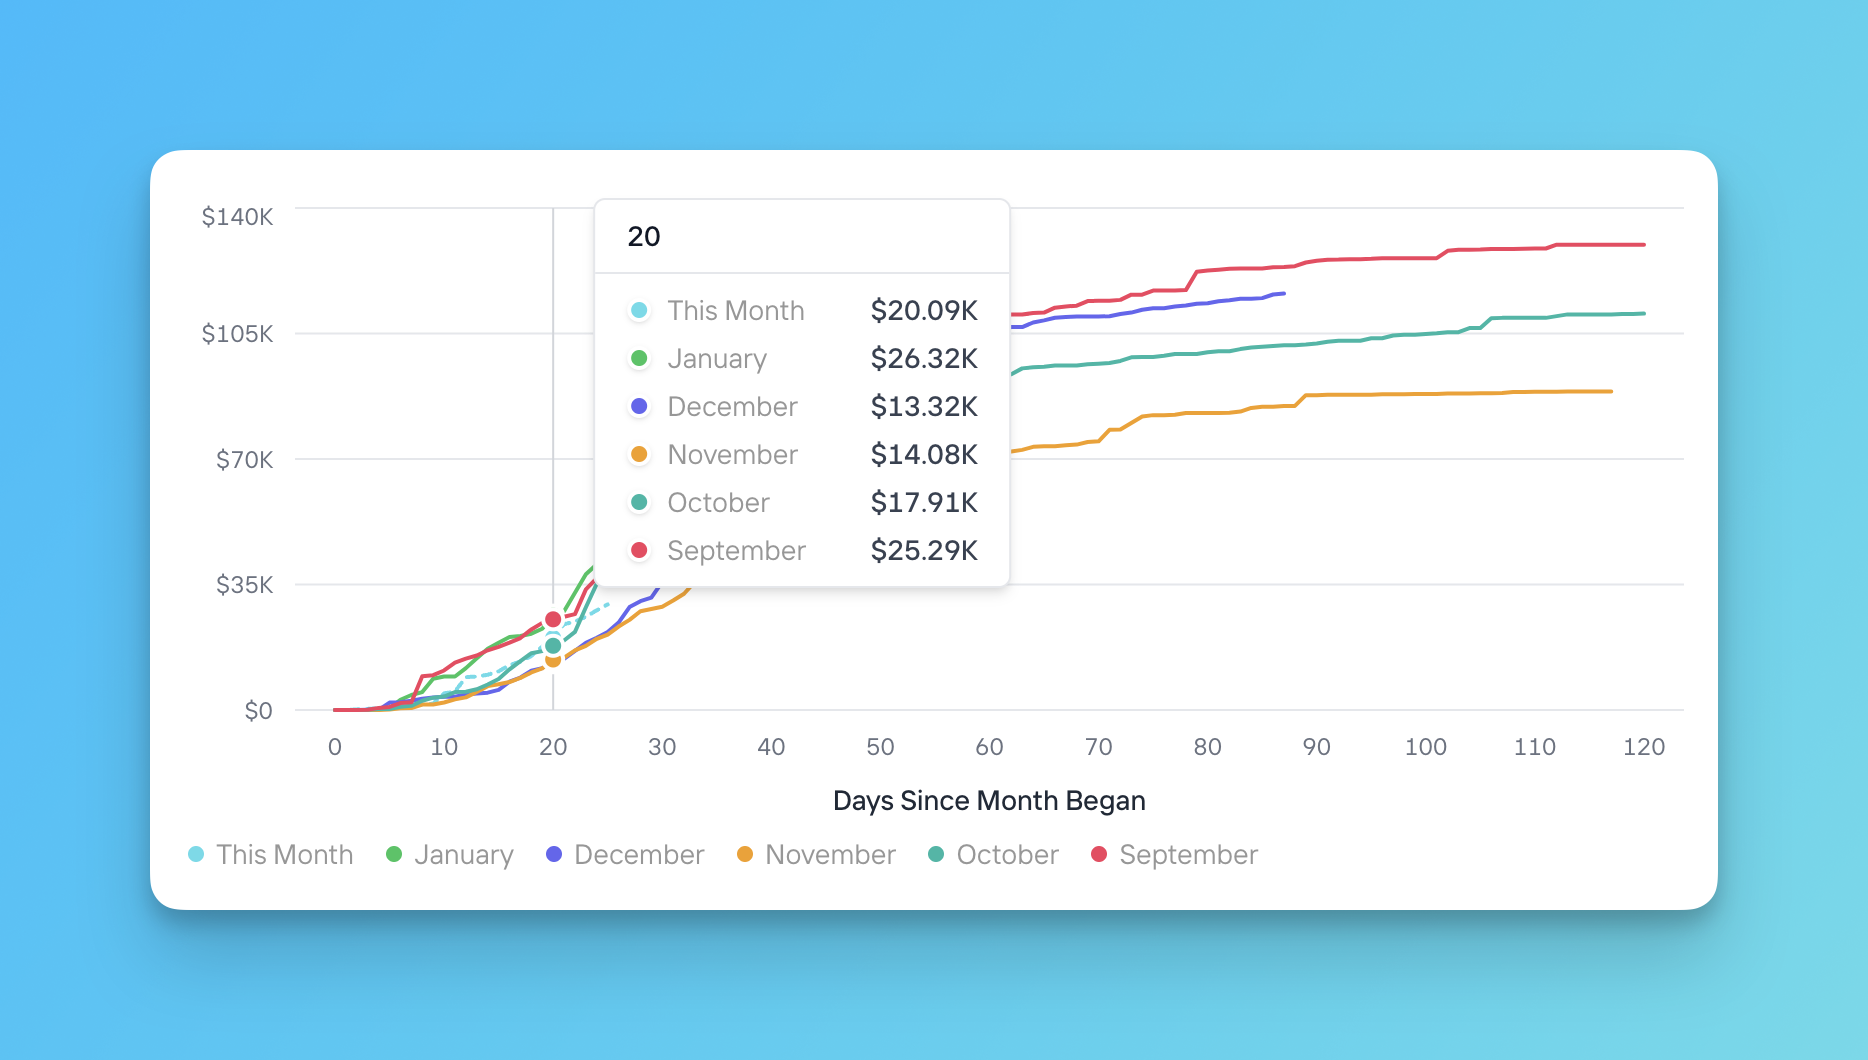
To produce the Arrivals chart, we need to know the original transaction date for a disputed transaction. If a processor doesn’t pass this information with a chargeback, then it won’t be included in this chart.
Chargeback Win Rate By Reason Category
Every chargeback comes with a reason code assigned by the associated card brand to best represent the customer’s underlying concerns. These reason codes give you guidance on how to respond to individual chargebacks (i.e. accept or fight) and what changes you may need to make to either detect service issues and fraud earlier in the customer journey, or flag technical issues that need remediation. When Pagos ingests your payments data, we aggregate your chargeback volume from each individual processor into a single data feed. Doing so requires some back-end work to harmonize similar dispute reason codes from the different card brands into Pagos-defined chargeback reason categories. The Chargeback Win Rate by Reason Category chart demonstrates how successful you’ve been in fighting chargebacks in each individual category. Use this to identify the types of chargebacks you’re most likely to win moving forward. The table beneath this chart goes one step further, listing the win rate alongside the count and value of all chargebacks in each category. You can even click on each category to break this data down further by subcategory. This information provides insights into where you may have issues in your setup or where to commit your chargeback-fighting resources to have the greatest impact.Chargeback win rate is the percentage of chargebacks in a given reason category that you fought and won, calculated as chargebacks won divided by total chargebacks in that category. Note the denominator includes all chargebacks, whether you challenged them or not.
Chargebacks Filter Options
You can apply the following filter options to the Chargebacks Risks page:- Date Range - Note that this filter doesn’t impact the Arrivals chart
- Compare to Previous - Note that this filter only impacts the Chargeback Win Rate By Reason Category line chart
- Processor
- Card Brand
- Card Type
- Payment Method Type
- Issuing Country
- Customer Country
Fraud
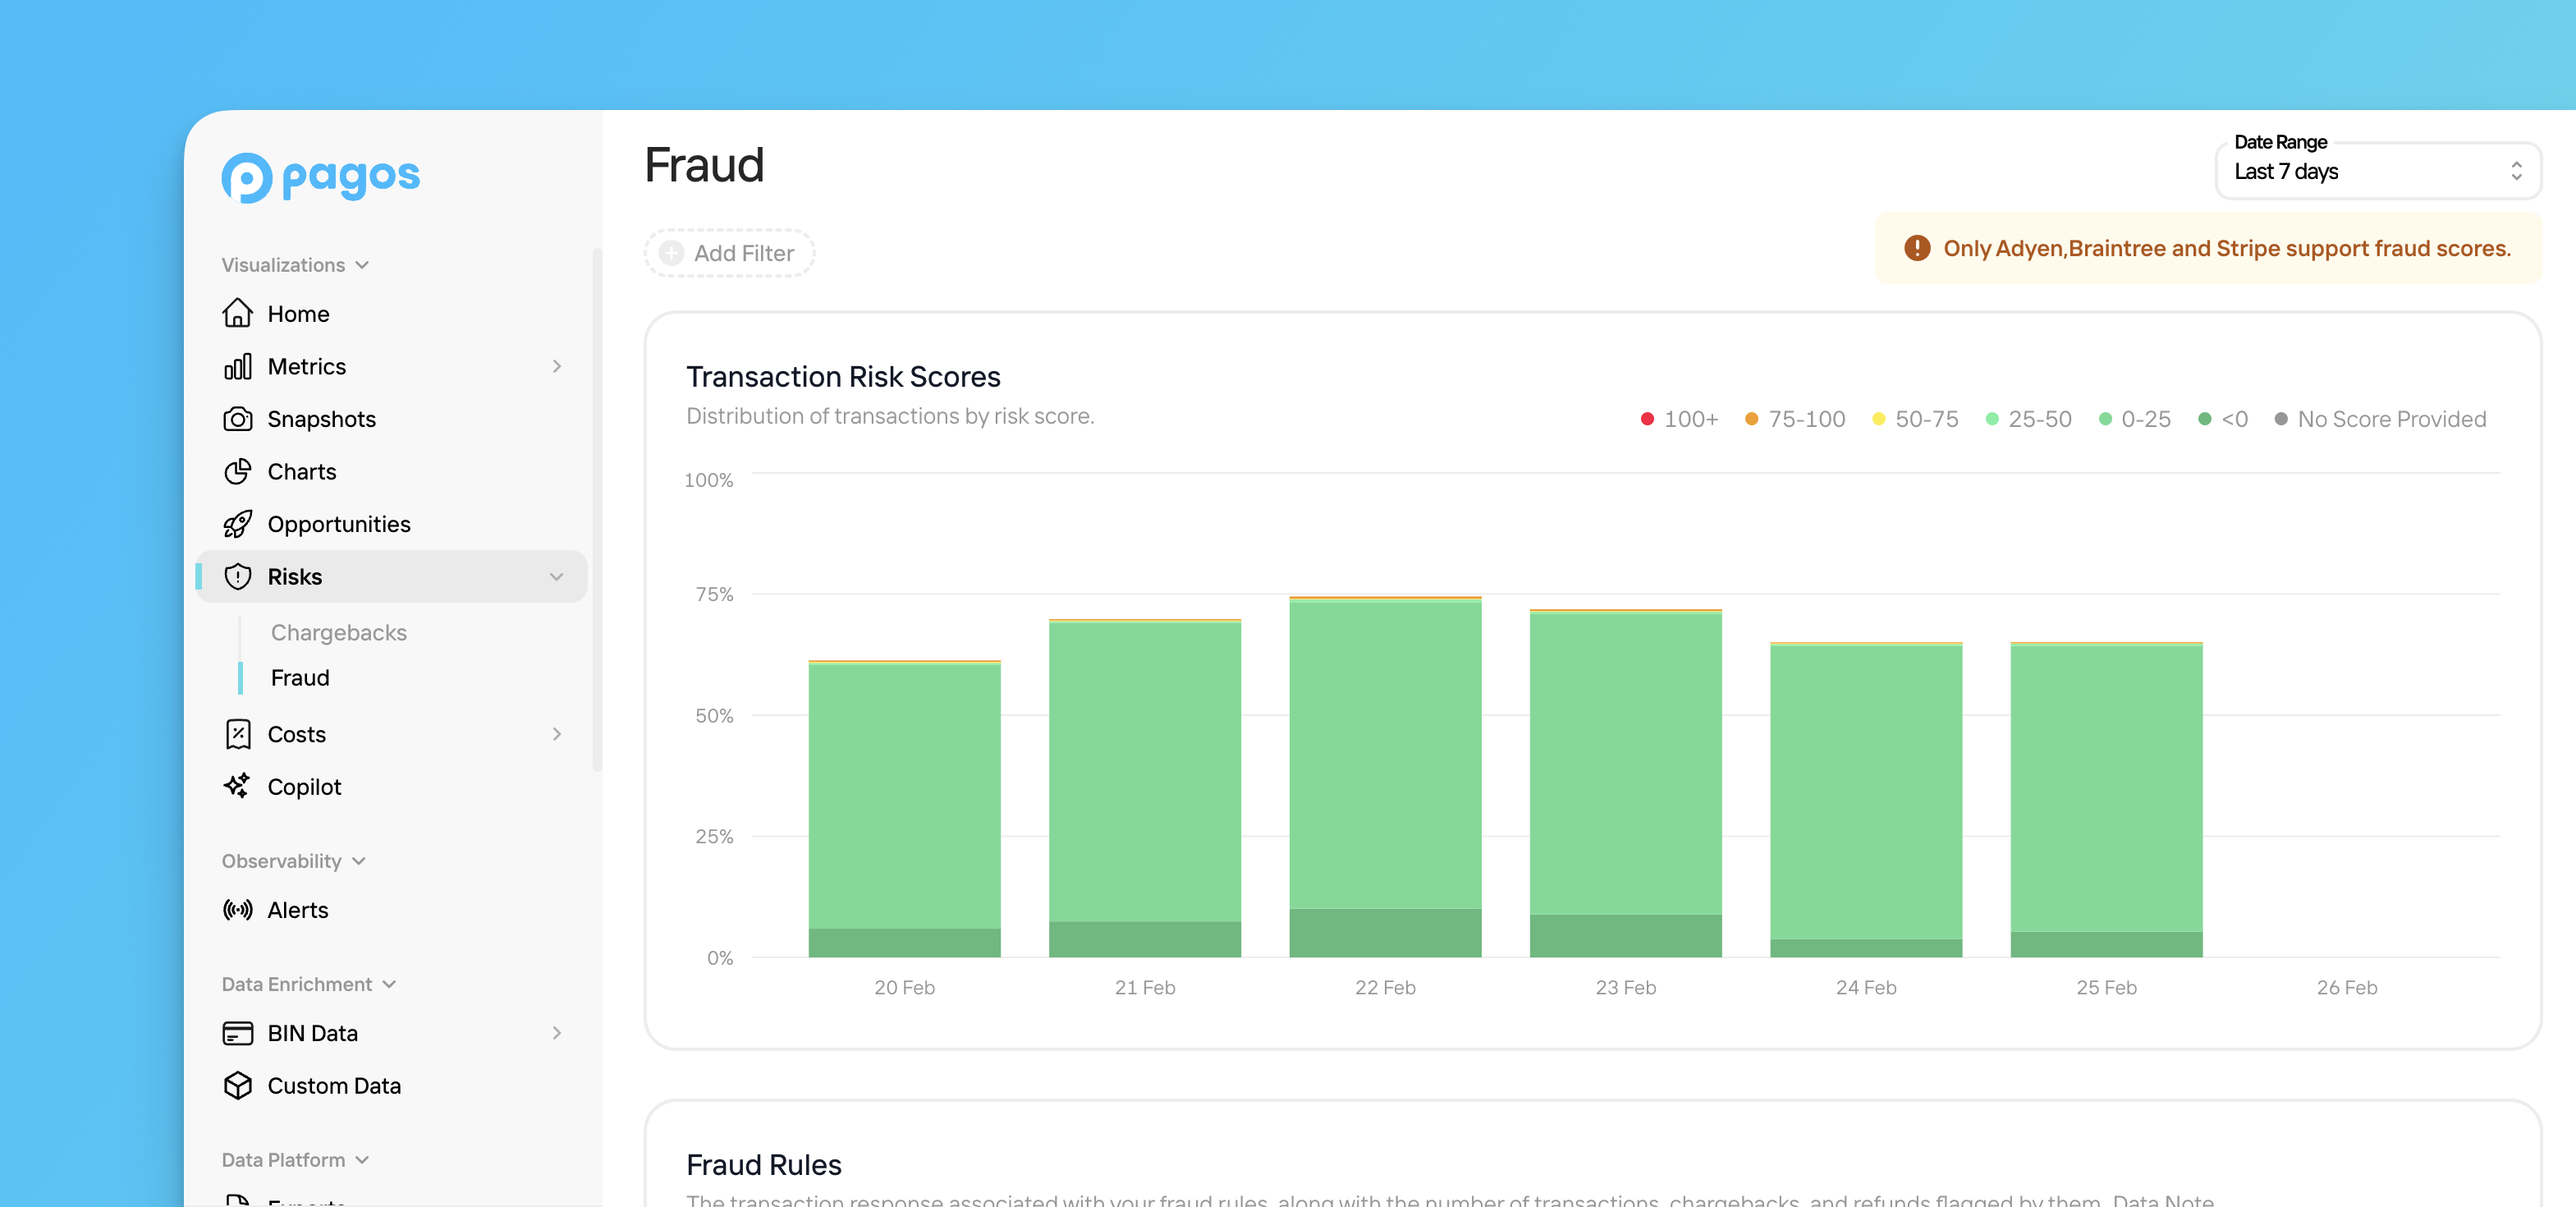
- Click Risks in the main navigation, then click Fraud.
- Use the Date Range filter in the top-right corner of the page to change the time period, or click Add Filter to apply a data filter to the page.
- At the top of the page, view a breakdown of your transaction volume by the processor-assigned risk scores in the Transaction Risk Scores graph.
- In the Fraud Rules table, explore your fraud rules (grouped or individualized) and the fraud scores assigned to transactions, chargebacks, and refunds flagged by them.
Transaction Risk Scores
The Transaction Risk Scores graph breaks down the distribution of your transaction volume over time into categories of risk score ranges. Pagos ingests these risk scores from Stripe, Braintree, and Adyen who generate them to help you evaluate the level of fraud risk associated with individual transactions. Any transactions that don’t have an associated risk score will be categorized under No Score Provided.Fraud Rules
The Fraud Rules table lists your fraud rules, along with the following details:- Transaction response elicited (Approved, Declined, or Blocked by Fraud Rule)
- Associated processor
- Risk score the processor assigns to transactions flagged by that rule
- Total number of transactions with that flag
- Total number of chargebacks with that flag
- Total number of refunds with that flag
Fraud Filter Options
You can apply the following filter options to the Fraud Risks page:- Date Range
- Processor
- Card Brand
- Card Type
- Payment Method Type
- Stored Credential
- Issuing Country
- Presentment Currency