Navigating the Alerts Section
1
Navigate to Alerts
Click Alerts in the main navigation.
2
Review Alerts at a glance
The Alerts page is broken into sections for each key payment metric. Each section contains a visual representation of the last 90 days, with each day (see timezone information below) demonstrated by a grey, green, or red bar:
Grey - Not Available
Grey - Not Available
Grey bars indicate days for which data is not available:
- If a historical date is grey, we didn’t evaluate your data that day for anomalies
- If the most recent date is grey, we may still be processing your incoming data.
- For chargeback metrics, grey can also indicate your chargebacks volume on that date was too low to meet the required threshold.
Green - No New Issues
Green - No New Issues
Green bars indicate no new anomalies were detected that day. Your data was consistent with historical measurements and didn’t cross your custom static thresholds.
Red - Alert
Red - Alert
Red bars indicate an alert—we have registered an anomaly in your payments data. Where you see red, you may have a problem worth digging into.
3
Dig into the data
Under a chosen metric, click the bar for a given day. This opens an Alerts Metric Details page containing the following data visualizations focused on that date:
4
Build out Custom Segments (Optional)
If you have specific market segments you need to monitor or static threshold values you target (e.g. 90% approval rate), navigate to any Alert Metric Details page and click Custom Segment to customize your data monitoring.
Alert Notifications
When an anomaly occurs in your data and generates an alert, you can receive a notification in the Pagos Service Panel, via email, or even in a Slack channel. Learn how to configure these notifications in the Managing Your Pagos Account guide.Alert Timing
A “day” in the Alerts section is measured as 12:00AM - 11:59PM UTC. If your account is set to a different time zone, the exact measurements shown for a specific day in Alerts may not match what you see for that same day in other charts within the Pagos Service Panel. Your data connection type determines when Pagos receives and reviews segments of your data for anomalies:- Direct, no-code data connections (e.g. Braintree, Stripe, Adyen) and the Data Ingestion API - We begin reviewing your data from the previous day at approximately 2AM UTC; as we receive and process more data segments, your dashboard updates continuously.
- File-based connections (e.g. JP Morgan Chase, WorldPay Vantiv) - Alerts appear in the dashboard after Pagos receives and processes your files. To ensure data completeness, this can take up to three days. While we review the data, the bar for that day will appear grey.
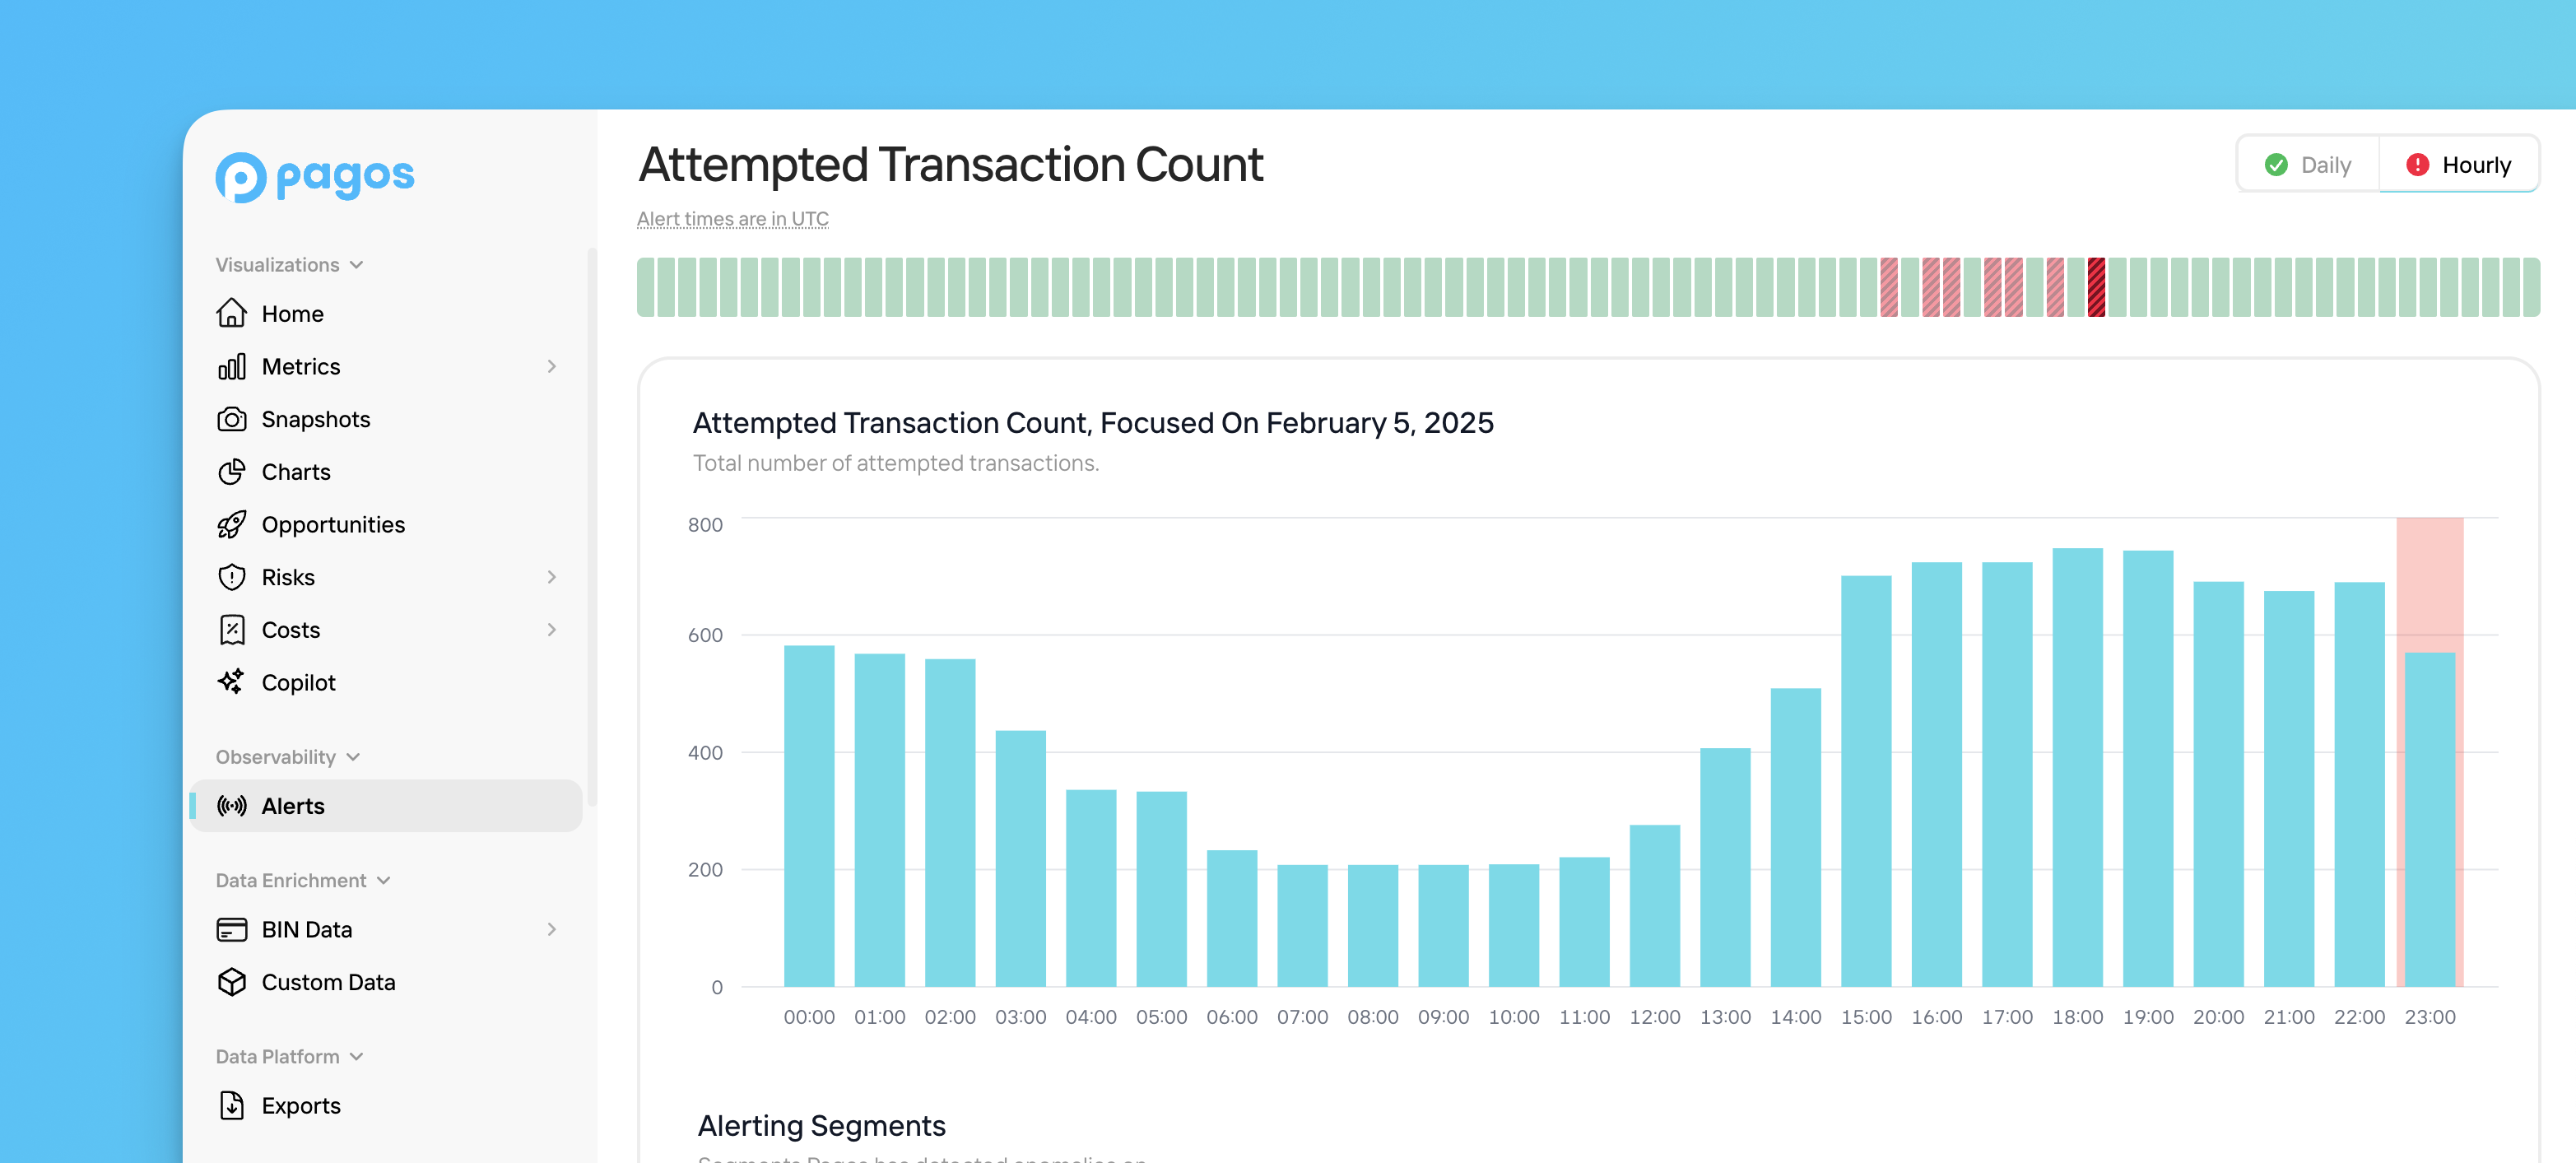
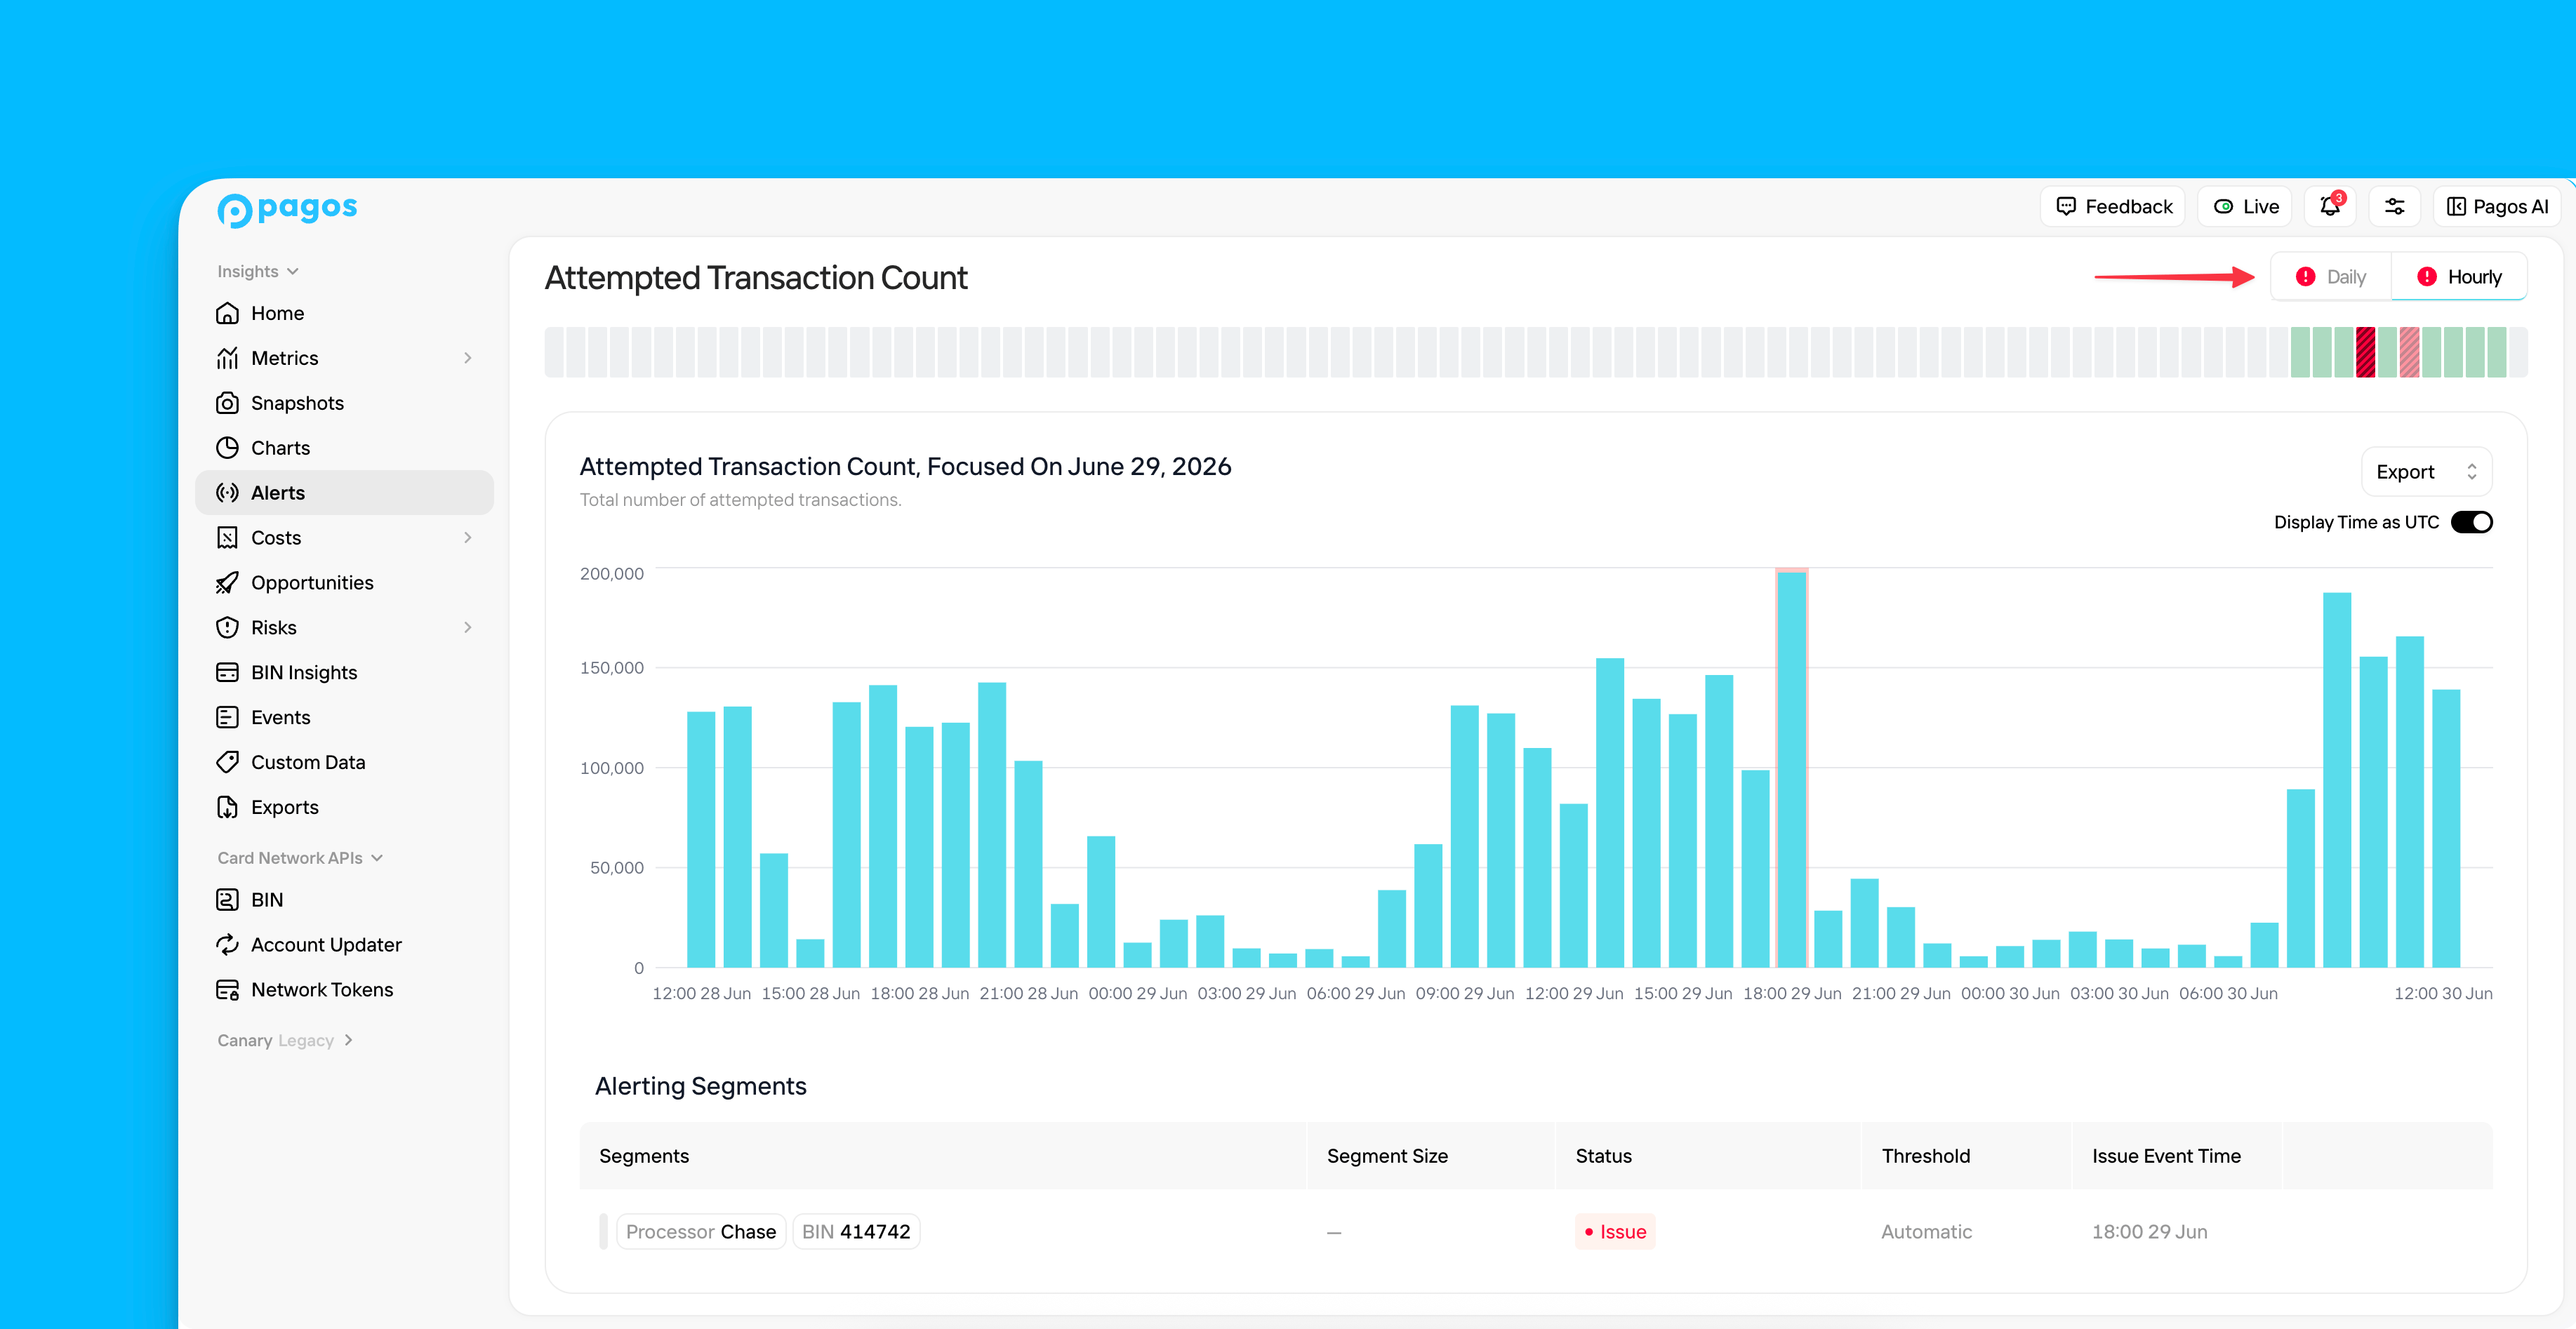
Hourly Alerts (Beta)
For Approval Rate and Attempted Transaction Count, we monitor both daily and hourly data ingested from your processors. Click the Daily/Hourly switcher in the top-right corner of the details page to view hourly data for the selected day. If you have anomalies in your hourly data, the Hourly icon will be red, and the data visualizations on the hourly details page will highlight the specific hours where you experienced an anomaly.View Hourly Alerts Toggle
View Hourly Alerts Toggle
At this time, hourly alerts have the following limitations:
- Hourly alerts don’t trigger notifications
- Pagos can’t monitor custom segments on an hourly cadence
Alert Metrics
Identify at a glance when your business experienced unexpected and abnormal changes to the following key payment metrics:Transaction Metrics
Approval Rate
Approval Rate
The percentage of transactions processed that were ultimately approved, calculated by dividing by the total number of approved transactions by the total number of attempted transactions
Attempted Transaction Count
Attempted Transaction Count
The total number of attempted transactions
Decline Rate
Decline Rate
The percentage of total attempted transactions declined with a specific decline code; calculated by dividing the total number of declines with that decline code by the total number of attempted transactions
Refund Metrics
Refund Count
Refund Count
The total number of refunded transactions
Chargeback Metrics
Chargeback Count
Chargeback Count
The total number of disputed card-based transactions
Focus Graph
The first visual on the Alerts Metric Details page is a focus graph. This graph demonstrates the chosen metric over the course of a week for your entire transaction volume, with the focus date in the middle of the week. This provides context on how that focus day measures up against the surrounding days. For count or value metrics (e.g. attempted transaction count), this will be a bar graph; rate metrics (e.g. approval rate) will appear as line graphs. If you click the Focus icon for any particular segment in the Alerting Segments or Monitored Segments sections, this graph will filter to only show the data for the chosen segment over that same week. Click Focus again to remove the filters from the graph.Export Options
Alerts is a starting point for identifying areas of concern in your payments data. To continue your analysis, you can seamlessly navigate to another area of the Pagos Service Panel and view the same data from a different angle. To do so, click Export in the top-right corner of your focus graph, then select from the following options under Open with:Metrics
Metrics
Charts
Charts
Open Charts with a custom visualization of the exact same data in your Alerts focus graph. Charts has more features for data manipulation, including additional filter options and chart styles. Save your chart for future use, so you can continue to monitor this concerning data segment.
Events
Events
Open the Events page to view the exact transaction events behind the data in your focus chart.
If you focus the Alerts graph on any particular data segment, those filters will carry over to any of the Open with… options.
Alerting Segments
An anomaly alert for one of your metrics doesn’t always mean there’s been a widespread issue across all of your transaction volume. More often, it indicates specific segments of your business have experienced unexpected changes significant enough to trigger the alert. The Alerting Segments section identifies the exact segment(s) of your business for which the data anomaly is closely tied. Hover over the segment name to reveal a Focus icon; click this icon to change the focus graph to only show data for that particular segment. With this information, you can filter other charts and graphs in Insights (e.g. Metrics, Charts, etc.) by this segment to dig further into the root cause of this sudden change. For a full list of the segments Alerts monitors for anomalies, see the next section below.For Decline Rate alerts, the alerting segment will identify both the segment(s) of transactions impacted and the exact transaction reseponse code (decline code) observed.
Monitored Segments
At the bottom of the Alerts Metric Details page, you’ll find a Monitored Segments table listing all the business segments Pagos monitors for anomalies, along with a status of either Issue or No New Issues. Hover over a segment name in this table to reveal a Focus icon. Click this icon to change the focus graph to only show data for that segment. We identify a segment by filtering for all transactions associated with a single parameter within one of the following data filters:- Processor
- Payment method
- Stored credential
- Card brand
- Card type
- BIN (Attempted Transaction Count only)
- Issuing country
- MID - To evaluate a MID for any Alert metric, the MID must have >1,000 transactions in the last 30 days and >100 transaction on the alert date.
Custom Segments
With custom segments, you can define the exact market segment you want Pagos to monitor for anomalies. To create a new custom segment:1
Select a Metric
On the main Alerts page, decide which payment metric you want to build a custom segment around. Click the bar for any given day under that metric to open an Alert Metric Details page.
2
In the Monitored Segments section, click Custom Segment to open a side panel.
3
Select a Threshold Type
Click one of the following tabs to select your Threshold Type:
- Automatic - Define the market segment and receive an alert when we register an anomaly (i.e. a measurement that’s inconsistent with your historical data).
- Static - Define both the market segment and a static threshold measurement; you’ll receive an alert whenever your metric measures above/below that threshold. Use this threshold type if your business has specific KPIs you monitor for.
4
Set a Threshold Value (Static Thresholds only)
Enter a static threshold value, then select whether you want to receive an alert when your metric measures Above or Below that value.
5
Filter by Processor
For all custom segments, specify the Processor you want to monitor for anomalies. This field is required.
6
Filter by Decline Code (Decline Rate monitoring only)
When building a custom segment for Decline Rate, select the Decline Code you want to monitor. This field is required.
7
Apply Optional Filters
For most metrics, you can apply up to two additional filter segments to further narrow down the market segment. Click Filter, select from the available options, then select a parameter from the drop-down.
For Decline Rate custom segments, you can only apply up to one additional filter.
8
Click Create Segment.
Keep in mind the following when using Static thresholds in custom segments:
- If your custom segment already appears in the Monitored Segments list (i.e. it has a high historical transaction count), we’ll alert you both when the metric crosses your static threshold and when we detect an anomaly based on your historical data.
- If your segment has a low transaction count and doesn’t meet the criteria for Monitored Segments, we’ll only alert you when the metric crosses your static threshold; statistical anomalies won’t be evaluated.
Subscribing to Custom Segment Alerts
By default, only the user who creates a custom segment receives anomaly notifications. That being said, all custom segments created by users within your Organization will appear in the Monitored Segments and Alerting Segments lists for the associated metric. The following icons indicate your relationship with a given custom segment:- - You created the custom segment and are subscribed to its alerts
- - Another user created the custom segment and you’re subscribed to its alerts
- - Another user created the custom segment and you’re not subscribed to its alerts