> ## Documentation Index
> Fetch the complete documentation index at: https://docs.pagos.ai/llms.txt
> Use this file to discover all available pages before exploring further.
# Refunds
> Perform a daily healthcheck of your refund metrics in this high-level dashboard.
 ## Navigating Refunds
To explore the Refunds Metrics pages:
Click **Metrics** in the main navigation, then click **Refunds**.
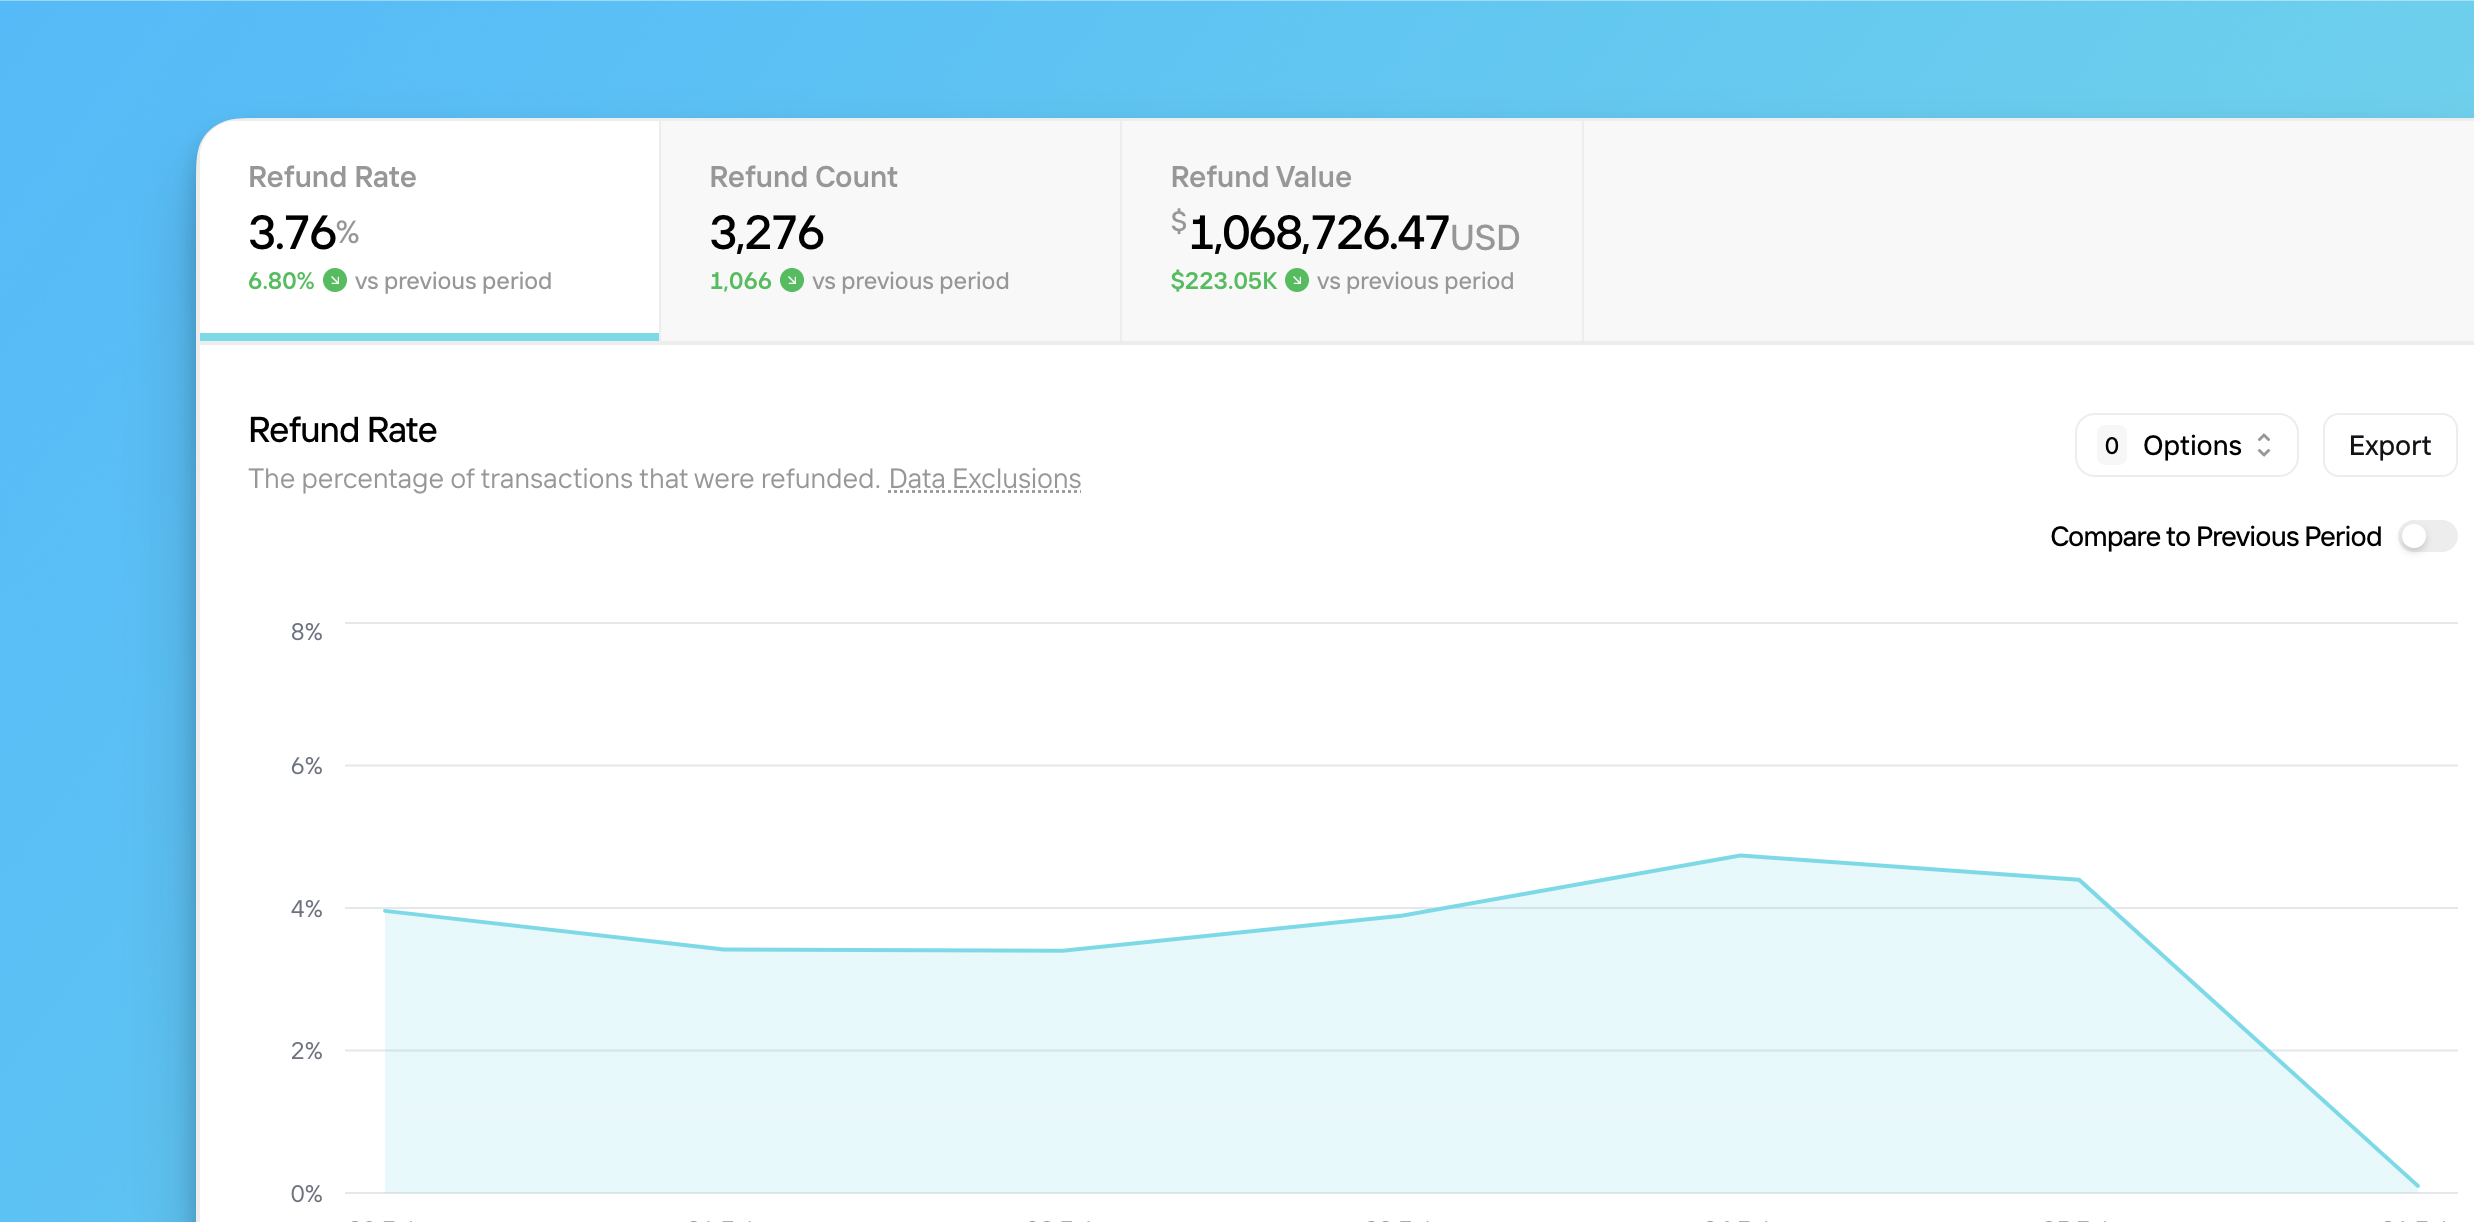
Each tab represents a different metric relevant to your refund data. Click a tab to view a graph of the associated metric over the last seven days. Your options include:
The percentage of total transactions successfully refunded in a given time period; calculated by dividing the total number of refunds processed by the total number of transactions; the bar lists in this tab show refund count
The total number of successful refunds processed in a given time period
The total combined value of all successful refunds processed in a given time period
Use the **Date Range** filter in the top-right corner of the page to change the time period.
Click the **Compare to Previous Period** toggle to view the value of that metric in the chosen time period side-by-side with that of the previous period, including the total or percent change in that value from one period to the next.
Click **Options**, then select from the following (availability varies by metric):
* **Frame Relevant Range** - Zoom in on the relevant range of values on the y-axis
* **View Distribution** - Adjust the chart to show the percent distribution of your data across a set of parameters; this option only appears for count and value tabs when using [**Focus**](/insights/metrics/overview#focus) mode
* **Show Trend Line** - Add a line demonstrating a statistical trend over the selected date range
**Trend Line Notes**
* The Trend Line option doesn't appear when using [**Focus**](/insights/metrics/overview#focus) mode.
* Trend lines exclude the most recent time interval (e.g. this week when viewing a weekly [date range](/insights/insights-data-filters#date-range), or the last two days for daily intervals), as your data for that time is still coming in and could skew the trend.
Use the [bar lists](#bar-lists) beneath the main graph to filter your data. Learn more about filtering Metrics pages in the [Overview](/insights/metrics/overview#filtering-metrics-pages).
Click **Export** to select from the following options:
* [**Open With...**](/insights/metrics/overview#open-with) - Select from the available options to continue your analysis in a different section of your Pagos Service Panel.
* **Aggregated Data** - Download the data displayed in the chart. If you've [filtered](/insights/metrics/overview#filtering-metrics-pages) or [focused](/insights/metrics/overview#focus) your data to any particular dimensions or parameters, these customizations will be reflected in the exported data.
* **Transaction-Level Data** - If you're subscribed to [Transaction-Level Data Exports](/insights/data-exports), you can download the data for the individual transactions included in the chart. Downloaded charts will appear in your **Exports** page; keep in mind, each report download is subject to your pricing agreement.
## Bar Lists
You can use bar lists on the Refunds page to identify which segments of your business are associated with the most refunds. Click on a parameter in any graph to [filter](/insights/metrics/overview#filtering-metrics-pages) all graphs on the page to only show transactions that fit the chosen parameter.
The available bar lists include:
* [Refund Status](/response-codes/refunds/refund-status-codes)
* Processor
* Data Connection
* MID
* Payment Method
* Card Type
* Card Brand
* Stored Credential
* Customer Country
* Issuer Country
* BIN
* Issuer
## Navigating Refunds
To explore the Refunds Metrics pages:
Click **Metrics** in the main navigation, then click **Refunds**.
Each tab represents a different metric relevant to your refund data. Click a tab to view a graph of the associated metric over the last seven days. Your options include:
The percentage of total transactions successfully refunded in a given time period; calculated by dividing the total number of refunds processed by the total number of transactions; the bar lists in this tab show refund count
The total number of successful refunds processed in a given time period
The total combined value of all successful refunds processed in a given time period
Use the **Date Range** filter in the top-right corner of the page to change the time period.
Click the **Compare to Previous Period** toggle to view the value of that metric in the chosen time period side-by-side with that of the previous period, including the total or percent change in that value from one period to the next.
Click **Options**, then select from the following (availability varies by metric):
* **Frame Relevant Range** - Zoom in on the relevant range of values on the y-axis
* **View Distribution** - Adjust the chart to show the percent distribution of your data across a set of parameters; this option only appears for count and value tabs when using [**Focus**](/insights/metrics/overview#focus) mode
* **Show Trend Line** - Add a line demonstrating a statistical trend over the selected date range
**Trend Line Notes**
* The Trend Line option doesn't appear when using [**Focus**](/insights/metrics/overview#focus) mode.
* Trend lines exclude the most recent time interval (e.g. this week when viewing a weekly [date range](/insights/insights-data-filters#date-range), or the last two days for daily intervals), as your data for that time is still coming in and could skew the trend.
Use the [bar lists](#bar-lists) beneath the main graph to filter your data. Learn more about filtering Metrics pages in the [Overview](/insights/metrics/overview#filtering-metrics-pages).
Click **Export** to select from the following options:
* [**Open With...**](/insights/metrics/overview#open-with) - Select from the available options to continue your analysis in a different section of your Pagos Service Panel.
* **Aggregated Data** - Download the data displayed in the chart. If you've [filtered](/insights/metrics/overview#filtering-metrics-pages) or [focused](/insights/metrics/overview#focus) your data to any particular dimensions or parameters, these customizations will be reflected in the exported data.
* **Transaction-Level Data** - If you're subscribed to [Transaction-Level Data Exports](/insights/data-exports), you can download the data for the individual transactions included in the chart. Downloaded charts will appear in your **Exports** page; keep in mind, each report download is subject to your pricing agreement.
## Bar Lists
You can use bar lists on the Refunds page to identify which segments of your business are associated with the most refunds. Click on a parameter in any graph to [filter](/insights/metrics/overview#filtering-metrics-pages) all graphs on the page to only show transactions that fit the chosen parameter.
The available bar lists include:
* [Refund Status](/response-codes/refunds/refund-status-codes)
* Processor
* Data Connection
* MID
* Payment Method
* Card Type
* Card Brand
* Stored Credential
* Customer Country
* Issuer Country
* BIN
* Issuer