> ## Documentation Index
> Fetch the complete documentation index at: https://docs.pagos.ai/llms.txt
> Use this file to discover all available pages before exploring further.
# Metrics Overview
> The Metrics section of Insights provides a high-level view of the payment metrics we deem most important for any business.
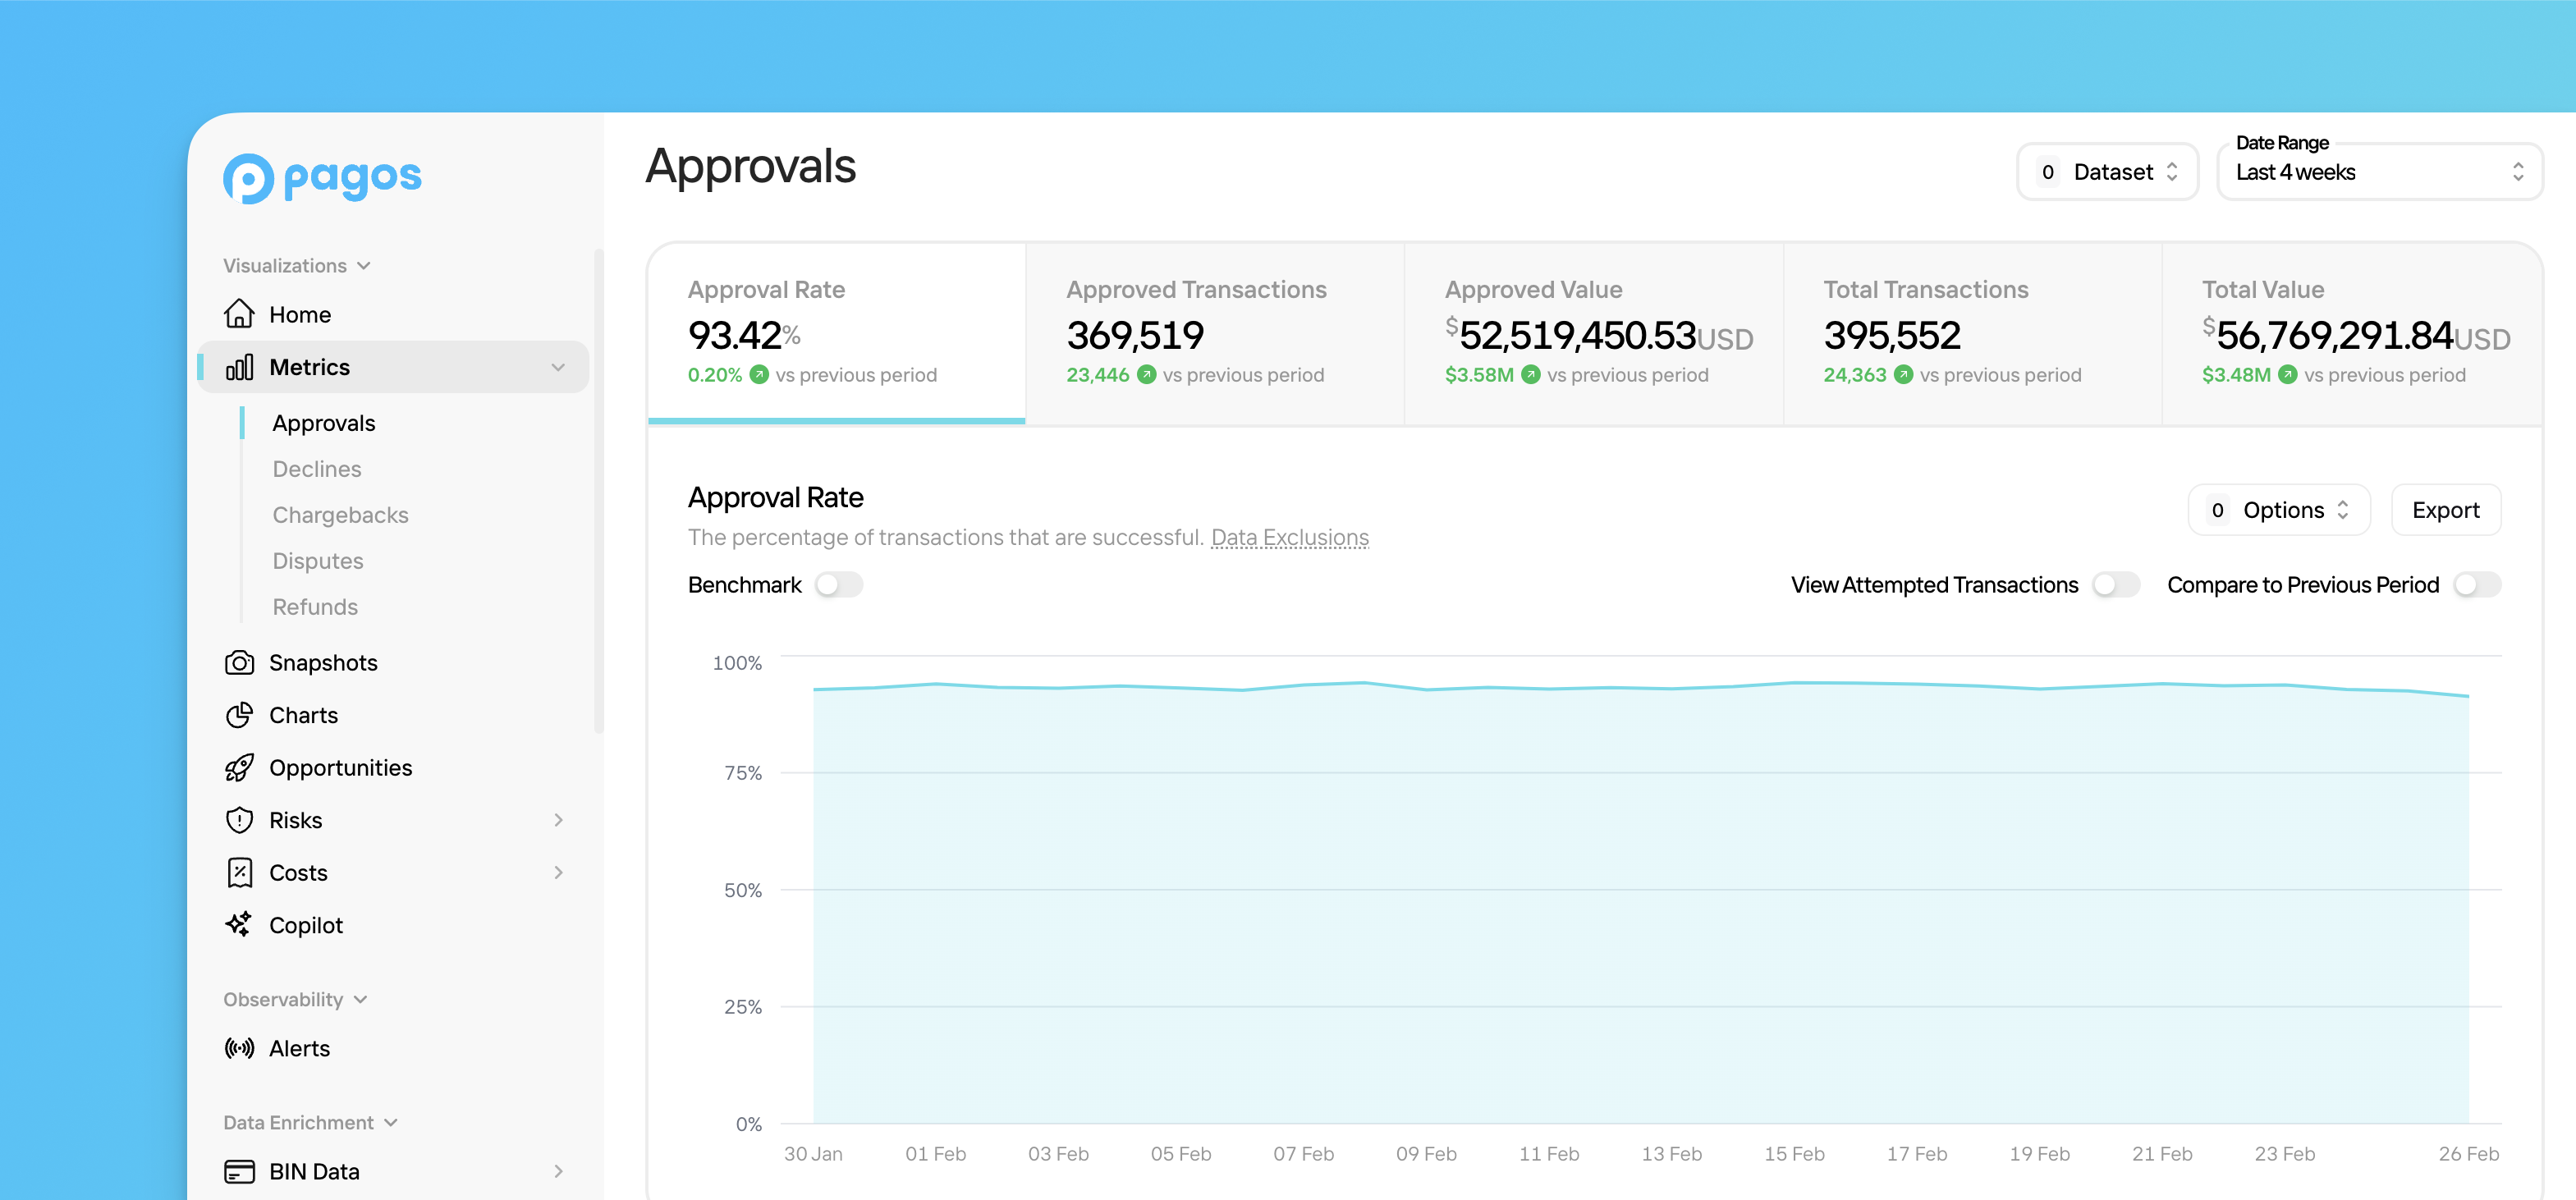 ## Navigating Metrics
To explore the Metrics pages, click **Metrics** in the main navigation, then click the desired Metrics page. Learn more about each page and the payments data it demonstrates in the relevant guide:
* [Approvals](/insights/metrics/approvals)
* [Declines](/insights/metrics/declines)
* [Chargebacks](/insights/metrics/chargebacks)
* [Disputes](/insights/metrics/disputes)
* [Refunds](/insights/metrics/refunds)
## Filtering Metrics Pages
Each page contains a main graph demonstrating a specific metric over time. Beneath the main graph, is set of **bar lists** breaking down your data by different parameters (e.g. Processor, Card Brand, BIN, etc). Click a parameter to filter all graphs across all tabs on the page by your chosen parameter.
For example, if you wanted to filter the **Approvals** page to only show data for Visa credit card transactions processed through Braintree, you could click the following parameters in the bar lists:
* **Processor** - Braintree
* **Card Type** - Credit
* **Card Brand** - Visa
Doing so filters all graphs on the page—including the main graph—to show only transactions that fit the chosen parameters. The filter names and parameters appear at the top of the page to remind you what filter you've applied. The filter remains in place as you move between the tabs to change which metric appears in the main graph.
## Navigating Metrics
To explore the Metrics pages, click **Metrics** in the main navigation, then click the desired Metrics page. Learn more about each page and the payments data it demonstrates in the relevant guide:
* [Approvals](/insights/metrics/approvals)
* [Declines](/insights/metrics/declines)
* [Chargebacks](/insights/metrics/chargebacks)
* [Disputes](/insights/metrics/disputes)
* [Refunds](/insights/metrics/refunds)
## Filtering Metrics Pages
Each page contains a main graph demonstrating a specific metric over time. Beneath the main graph, is set of **bar lists** breaking down your data by different parameters (e.g. Processor, Card Brand, BIN, etc). Click a parameter to filter all graphs across all tabs on the page by your chosen parameter.
For example, if you wanted to filter the **Approvals** page to only show data for Visa credit card transactions processed through Braintree, you could click the following parameters in the bar lists:
* **Processor** - Braintree
* **Card Type** - Credit
* **Card Brand** - Visa
Doing so filters all graphs on the page—including the main graph—to show only transactions that fit the chosen parameters. The filter names and parameters appear at the top of the page to remind you what filter you've applied. The filter remains in place as you move between the tabs to change which metric appears in the main graph.
 For most bar lists, you can't filter by more than one parameter within the same category; for example, you can't filter for transactions made with two different payment methods (e.g. card and PayPal). To filter by more than one processor, data connections, or MID, however, use the **Processor** filter at the top of the page.
### Focus
For most bar lists, you can't filter by more than one parameter within the same category; for example, you can't filter for transactions made with two different payment methods (e.g. card and PayPal). To filter by more than one processor, data connections, or MID, however, use the **Processor** filter at the top of the page.
### Focus
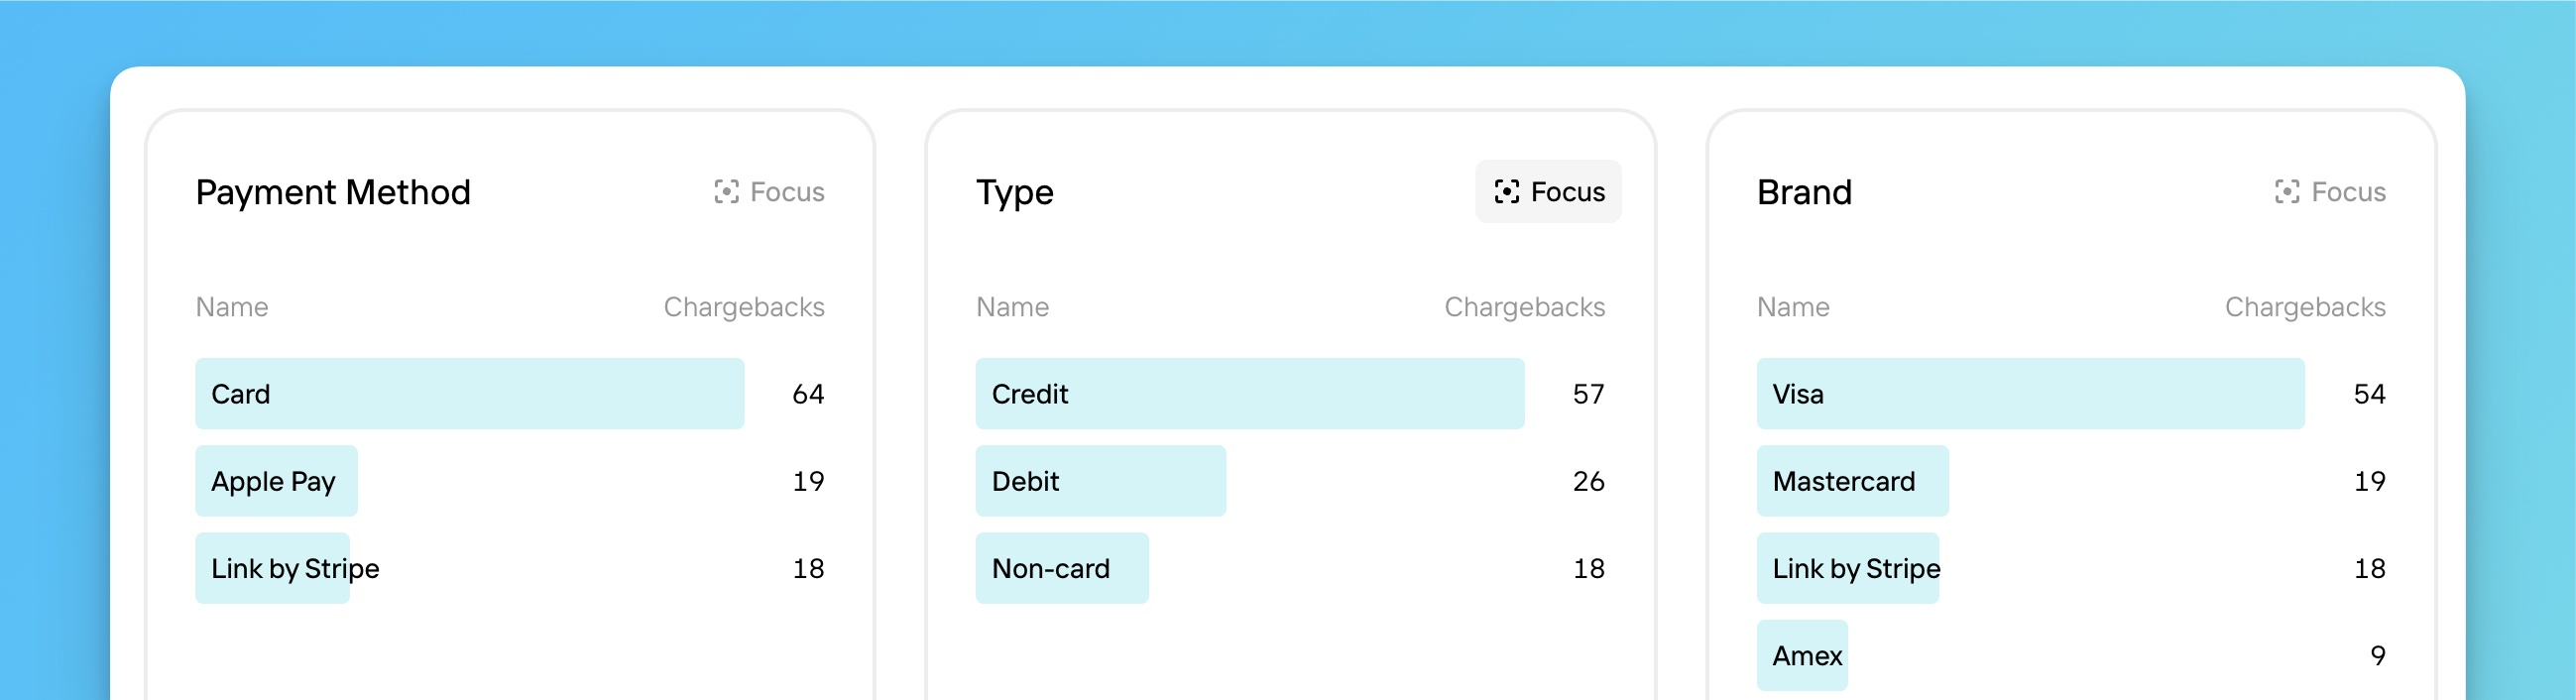 Most bar lists in the Metrics pages have a **Focus** icon in the top right corner. When you click this icon, the main graph changes to show the tab's metric broken down by the parameters of that bar list. This provides you with the flexibility to break down metrics by whatever dimensions interest you. For example, clicking **Focus** on the **Processors** bar list in the **Approval Rate** tab, generates a line graph showing approval rate over time for each individual processor. Use the legend below the main graph to select or deselect parameters from the chosen focus dimension.
## Open With
After using the [filter](#filtering-metrics-pages) or [focus](#focus) features to identify interesting segments of your data in Metrics, you may then want to dig deeper. Click **Export** in the top-right corner of the main graph, then select from the following options under **Open with**:
Open [Charts](/insights/charts) with a custom visualization built from the exact data you already filtered for. You can apply additional filters, change the style of chart, and even save your custom chart for future use.
Keep in mind the following data limitations when you use this feature to navigate from Metrics to Charts:
* If you select **Data Connection** as the [focus](#focus) in Metrics, the custom chart will demonstrate your data across **MIDs**
* If you apply the **Compare to Previous Period** toggle, it will be ignored in the custom chart
* If you select the Visa or Mastercard [chargeback formulas](/insights/metrics/chargebacks#visa-formula) on the Chargebacks page, the custom chart will still use the Pagos formula
Open the [Events](/insights/events) page to view the exact transaction events behind the data you filtered for. For example, if you're in the **Chargeback Rate** tab of the [Chargebacks](/insights/metrics/chargebacks) Metrics page and click **Open with Events**, the Events table will show the individual chargebacks used in the rate calculation.
Most bar lists in the Metrics pages have a **Focus** icon in the top right corner. When you click this icon, the main graph changes to show the tab's metric broken down by the parameters of that bar list. This provides you with the flexibility to break down metrics by whatever dimensions interest you. For example, clicking **Focus** on the **Processors** bar list in the **Approval Rate** tab, generates a line graph showing approval rate over time for each individual processor. Use the legend below the main graph to select or deselect parameters from the chosen focus dimension.
## Open With
After using the [filter](#filtering-metrics-pages) or [focus](#focus) features to identify interesting segments of your data in Metrics, you may then want to dig deeper. Click **Export** in the top-right corner of the main graph, then select from the following options under **Open with**:
Open [Charts](/insights/charts) with a custom visualization built from the exact data you already filtered for. You can apply additional filters, change the style of chart, and even save your custom chart for future use.
Keep in mind the following data limitations when you use this feature to navigate from Metrics to Charts:
* If you select **Data Connection** as the [focus](#focus) in Metrics, the custom chart will demonstrate your data across **MIDs**
* If you apply the **Compare to Previous Period** toggle, it will be ignored in the custom chart
* If you select the Visa or Mastercard [chargeback formulas](/insights/metrics/chargebacks#visa-formula) on the Chargebacks page, the custom chart will still use the Pagos formula
Open the [Events](/insights/events) page to view the exact transaction events behind the data you filtered for. For example, if you're in the **Chargeback Rate** tab of the [Chargebacks](/insights/metrics/chargebacks) Metrics page and click **Open with Events**, the Events table will show the individual chargebacks used in the rate calculation.