> ## Documentation Index
> Fetch the complete documentation index at: https://docs.pagos.ai/llms.txt
> Use this file to discover all available pages before exploring further.
# Charts
> The Charts section of Insights grants you the flexibility to build custom data visualizations.
Monitor and visualize any payment metric, broken down by the dimensions you're most concerned about, in whatever chart style meets your business needs. Fully customize your own charts to dive deep into the KPIs or customer segments most important to your company. With Chart [Collections](#collections), you can even build out a dashboard of custom charts with your own business or personal context built right in.
## Creating New Charts
To build a new chart:
Click **Charts** in the main navigation
Click the arrow beside **New Chart**, then select from the available [chart templates](#templates). To create a completely new chart from scratch, click **New Chart**.
Use the **Date Range** filter in the top-right corner of the page to select the time period you want to view data for.
Click **Metric**, then select a [payments data metric](#metrics) from the drop-down to populate your chart.
Click **Dimension**, then select a [dimension](#dimensions) to break down your chosen metric by in the chart. Keep in mind, the metric determines what dimensions appear in this menu; for example, a dispute-relevant dimension like **Dispute Reason** only appears when you select a dispute metric (e.g. **Dispute Count**).
Click **View**, then select how you want to visualize the data. The [View](#views) you select determines the type of chart created.
Click **Dataset**, then select from the following options:
Click the toggle, then select the type of transactions you want to deduplicate; the options include [Retries](/payments-basics/transaction-retry-deduplication) and any custom deduplication options you’ve set up.
Click toggle to remove pending transactions from your data.
Click toggle to include chargebacks resolved by Visa as Rapid Dispute Resolution, and those with the [status categories](/response-codes/chargebacks/chargeback-status-codes) of *cancelled*, *RFI*, *pre-arbitration*, *pre-dispute*, *notification\_of\_fraud*, and *pre-compliance*
After making your **Dataset** selections, you can click the **Apply to this Chart Only** toggle to save these filters to your chart; these settings will now stay in place even if you change the Dataset settings elsewhere in the Pagos Service Panel. When this toggles is disabled, these dataset settings aren't saved.
If available, click [**Options**](#options) to apply additional settings to the chart.
Click the **Compare to Previous Period** toggle to add data from the previous period to the graph.
The **Compare to Previous Period** toggle is only accessible on charts with the **Across Time** [View](#views) that do **not** have a secondary breakdown dimension.
Click **Breakdown** to open a drop-down menu, then select a secondary [dimension](#dimensions) to break down your metric by. For example, if you chart shows Approval Rate by Card Brand Across Time, you can use the **Breakdown** menu to further segment your approval rate by card type within each card brand.
The legend beneath the chart breaks down the values demonstrated above. Click a parameter to remove it from the chart.
To apply a [filter](/insights/insights-data-filters) to the displayed data, click **Add Filter** above the chart, then click a filter in the drop-down menu; select your preferred filter parameters and click **Apply Filters**. To remove a filter, click the **X** beside the filter name.
Click **Export** in the top-right corner of a custom chart to select from the following options:
* **Open With Events** - Navigate to the [Events](/insights/events) page, filtered to show the exact transaction events behind the data in your custom chart.
* **Aggregated Data** - Download the data displayed in the chart.
* **Transaction-Level Data** - If you're subscribed to [Transaction-Level Data Exports](/insights/data-exports), you can download the data for the individual transactions included in the chart. Downloaded data will appear in your **Exports** page; keep in mind, each report download is subject to your pricing agreement.
Click **Save** to save your custom chart for future use.
Check out our demonstration of how to use Charts on the [Pagos YouTube channel](https://youtu.be/eThixvyPmfA?si=K9XEApnvaHtNXwrW).
### Templates
If you're not sure where to start when customizing your own data visualization, use a Pagos chart template! While on the main **Charts** page, click the arrow beside **New Chart** to open the menu of template categories. Click a category to select from the available templates. The categories and templates include:
* *Declines by Decline Code* - View a breakdown of your declined transactions by the assigned decline code to discover why your transactions aren't being approved
* *Share of Declines by Decline Code* - View distribution of your declines across your most common declines codes
* *Average Order Value by Decline Code* - Uncover the average value of declined transactions broken down by the assigned decline code
* *Transaction Retry Attempts (Adyen Only)* - Visualize the extent of Adyen's transaction retry attempts
* *Transaction Count by Presentment Currency* - See which currencies your customers prefer to pay with
* *Average Order Value by Customer Country* - Uncover which currencies create the largest order sizes
* *Average Order Value by Presentment Currency* - Find which countries create the largest order sizes
* *Average Order Value by Payment Method* - Find the payment methods that create the largest order sizes
* *Approval Rate: Card Number vs Network Token* - Discover if your approval rate higher with card primary account numbers (PANs) or network tokens
* *Approval Rate for 3D Secure Transactions* - Measure the impact of 3D Secure on your approval rate
* *Approval Rate per CVV Flag* - View the impact of CVV flags on approval rate
* *Transaction Count by AVS Postal Flag* - View the correlation between AVS flags and transaction volume
* *Share of 3D Secure Transactions* - The percentage of your transactions that were went through 3D Secure
### Metrics
You can build custom charts using the following metrics:
The average amount of money each customer spends per transaction; calculated by dividing the total revenue received by the total number of orders processed.
The total number of attempted transactions processed.
The total value of all attempted transactions processed.
The percentage of transactions processed that were ultimately approved; calculated by dividing the total number of approved transactions by the total number of attempted transactions.
Charts for this metric include a **View Attempted Transactions** toggle; click it view your approval rate in context of the total attempted transaction count.
The total number of approved transactions.
The total value of all approved transactions.
The percentage of total attempted transactions that were ultimately declined; calculated by dividing the total number of declines by the total number of attempted transactions.
Charts for this metric include a **View Declined Transaction Count** toggle; click it view your decline rate in context of the total declined transaction count.
The total number of declined transactions.
The total value of all declined transactions.
The average order amount disputed by your customers.
The percentage of attempted card transactions for which customers issued chargebacks in a given time period, calculated by dividing this month’s chargeback count by this month’s attempted transaction count.
Charts for this metric include a **View Chargeback Count** toggle; click it view your chargeback rate in context of the total chargeback count.
The total number of successful card-based chargebacks processed in a given time period.
The total combined value of all successful card-based chargebacks processed in a given time period.
The percentage of total card chargebacks won in a set time period; calculated by dividing the total number of chargebacks in the CHARGEBACKS\_WON\_DEFENDED [status category](/response-codes/chargebacks/chargeback-status-category-codes) by the total number of chargebacks received.
The percentage of non-card transactions for which customers issued disputes, calculated by dividing this month's dispute count by this month's transaction count.
Charts for this metric include a **View Dispute Count** toggle; click it view your non-card dispute rate in context of the total dispute count.
The total number of non-card transactions that customers filed a dispute for.
The total value of non-card transactions that customers filed a dispute for in a given time period.
The percentage of total transactions successfully refunded in a given time period; calculated by dividing the total number of refunds processed by the total number of transactions.
Charts for this metric include a **View Refund Count** toggle; click it view your refund rate in context of the total refund count.
The total number of successful refunds processed in a given time period.
The total combined value of all successful refunds processed in a given time period.
The total amount of fees your business faced in a given time period, across all processors and fee categories.
The per-transaction fees your business faced in a given time period, across all fee categories.
Per-transaction fee amounts are only available for Adyen, Braintree, dLocal, PayPal, and Stripe.
The percentage of your total sales amount spent on interchange fees; calculated by dividing the total value of all fees with the `interchange` [fee type code](/response-codes/fees/fee-type-codes) by the total value of all approved transactions, unadjusted for chargebacks or refunds.
Interchange effective rate data is only available for Braintree, Stripe, Adyen, and dLocal.
The percentage of total verification attempts that succeeded in a given time period; calculated by dividing the total number of approved verifications by the total number of attempted verifications.
Charts for this metric include a **View Verification Count** toggle; click it view your verification approval rate in context of the total attempted verification count.
The total number of attempted verifications processed in a given time period.
The total combined value of all attempted verifications processed in a given time period.
### Dimensions
The dimension you select determines how the chart breaks down the chosen metric. For example, if you choose **Processor**, the chart will show your metric broken down across each of your processors. Keep in mind, the metric determines the available dimensions.
Choose from the following, organized into categories in the **Dimensions** drop-down menu:
* **Processor**
* **MID**
* **MCC** (Chase only)
* **BIN (Top 25)**
* **Card Brand**
* **Card Type**
* **Payment Method**
* **Network Tokens** - Groups transactions by those processed with network tokens (*true*) vs. PANs (*false*); transactions that don't include this data appear in the *no\_value\_provided* category
* [**Stored Credential**](/payments-basics/the-stored-credential-field)
* **Presentment Currency** - The currency a transaction was made in
* [**Transaction Status**](/response-codes/transaction-status-codes)
* **Transaction Response Code/Decline Code** - The response code assigned to a transaction; all approved transactions appear under *approved*, while declines are broken down by [decline code](/response-codes/transactions/transaction-response-codes)
* **Raw Transaction Response Code** - The full raw decline code and description exactly as it appears in the data ingested from your processor
* [**POS Entry Mode**](/response-codes/pos-entry-mode-codes) - The code identifying how a customer's payment card information was captured
* **Adyen Retry Attempt** - Adyen retries some failed transaction attempts based on their own internal logic; Pagos only counts the final attempt of a retried Adyen transaction in your ingested data, tagging it with a custom flag indicating the total number of times Adyen attempted the transaction (e.g. *initial\_attempt*, *second\_attempt*, etc)
* **Installment Count** - The number of installment payments selected for a given transaction (for payment methods with installment options)
* **Network Advice** - Guidance from the card network on why a transaction was declined and how to respond; keep in mind, not every network provides this data, and only Braintree and Adyen pass us the details
* **Presentment Currency**
* [**Dispute Reason**](/response-codes/chargebacks/chargeback-reason-codes) - Reason for non-card dispute
* [**Dispute Status**](/response-codes/chargebacks/chargeback-status-codes)
* **Rapid Dispute Resolution** - Whether or not a disputed non-card transaction was resolved by Visa as Rapid Dispute Resolution
* **Installment Count** - The number of installments the disputed non-card transaction was paid in (for payment methods with installment options)
* **Presentment Currency** - The currency of a disputed transaction
* [**Chargeback Reason**](/response-codes/chargebacks/chargeback-reason-codes)
* [**Chargeback Status**](/response-codes/chargebacks/chargeback-status-codes)
* **Rapid Dispute Resolution** - Whether or not a disputed transaction was resolved by Visa as Rapid Dispute Resolution
* **Installment Count** - The number of installments the disputed transaction was paid in (for payment methods with installment options)
* **Customer Country**
* **Customer Region**
* **Track Device Data**
* **Card Product Name**
* **Card Product Category**
* **Issuer Bank (Top 25)**
* **Issuer Country**
* **Issuer Region**
* **Durbin Regulated** - Whether or not the card used in the transaction was issued by a Durbin-regulated bank
* **CVV**
* [**AVS Line Code**](/response-codes/avs-response-codes#avs-line-code)
* [**AVS Postal Code**](/response-codes/avs-response-codes#avs-post-code)
* **3DS Authentication Result**
* [**3D Secure Code**](/response-codes/3ds-response-codes)
* **3D Secure Version** - The version of 3DS used to process transactions; transactions that don't include 3DS version information appear in the *no\_value\_provided* category
* **Adyen 3D Secure Type**
* **Presentment Currency** - The currency the original transaction was made in
* **Refund Reason** - Indicates the refund reason, if provided
* [**Refund Status**](/response-codes/refunds/refund-status-codes)
* **Installment Count** - The number of installments the original transaction was paid in (for payment methods with installment options)
* [**Fee Type**](/response-codes/fees/fee-type-codes)
* [**Fee Category**](/response-codes/fees/fee-type-category-codes)
* [**Fee Subcategory**](/response-codes/fees/fee-type-subcategory-codes)
* **Settlement Currency**
Some dimensions are only available for count and value metrics, not rate metrics. For example, **Chargeback Reason** is not an available dimension option when you chose **Chargeback Rate** as the metric, because chargeback reason codes are only applicable to the numerator of the chargeback rate equation (chargeback count) and not the denominator (approved transaction count).
### Views
The **View** you select determines the style of chart created. If you make a chart for a count or value [metric](#metrics) (e.g. approved transaction count or refund value), you can select from the following Views:
* **Across Time** - Stacked bar chart with time on the x-axis; the dimension's parameters make up each small bar within a stack
* **By Share** - Pie chart with the dimension's parameters making up each wedge
* **As Totals** - Bar chart with the dimension on the x-axis; the dimension's parameters each have their own bar
You can't choose a **View** in the following instances:
* Selecting a rate metric (e.g. approval rate) generates a line graph with time on the x-axis and the rate percentage on the y-axis.
* Selecting **BIN (Top 25)** or **Issuer Bank (Top 25)** as the [dimension](#dimensions) generates a table.
## Options
Depending on the [Metric](#metrics) and [View](#views) you selected, you will see an **Options** drop-down in the top-right corner of your chart. Click this menu to reveal the following toggles:
* **View Distribution** - Adjust the chart to show the percent distribution of your data across the chosen dimension's parameters. This option only appears for charts demonstrating a count or value Metric with the **Across Time** or **As Totals** View.
* **Frame Relevant Range** - Zoom in on the relevant range of values on the y-axis; this is especially valuable when the lines of a chart are very close together. This option only appears for charts demonstrating rate Metrics.
* **Original Transaction Dates** - This option only appears for charts demonstrating a chargeback or refund Metric. View chargebacks or refunds issued against transactions originally processed in the selected date range. When selected, the metric name adjusts to indicate this toggle was applied (e.g. **Chargeback Rate** becomes **Chargeback Rate (Date of Transaction)**).
* **Show Trend Line** - Add a line demonstrating a statistical trend over the selected date range.
**Trend Line Notes**
* The Trend Line option is only available for charts with the **Across Time** View.
* It doesn't appear in rate charts when the associated count toggle is on (e.g. in an Approval Rate chart with the **View Attempted Transactions** toggle turned on), or in charts with a secondary **Breakdown**.
* Trend lines exclude the most recent time interval (e.g. this week when viewing a weekly [date range](/insights/insights-data-filters#date-range), or the last two days for daily intervals), as your data for that time is still coming in and could skew the trend.
## Editing Existing Charts
To make changes to a previously saved chart:
Click **Charts** in the main navigation.
Click the **search** icon, then type the name of the desired chart to locate it. Click the **expand** icon in the top-right corner of your chart.
Click the **star** icon beside a [Collection](#collections) or chart's name to favorite it. Your favorited visualizations appear at the top of the main Charts page and on the Insights Home page when you first log in.
Favorites are unique to each Pagos user. Other users in your Pagos Organization can select their own favorite charts and Collections.
Change, add, or delete any existing fields or filters, then click **Save**. If you want to revert any changes, click **Reset** in the bottom-right corner.
Click the **pencil** icons beside the chart's name and description to make edits. Hit **enter** or click outside of the editor to save your changes.
Click the **...** icon beside the **View** drop-down menu, then select from the following options:
* **Duplicate Chart** - Create an exact copy of the existing chart
* **Delete Chart** - Permanently delete the chart
## Collections
**Collections** are sets of custom charts grouped together into a unique dashboard.
To create a Collection:
Click the **drag** icon in the top-right corner of any data visualization on the main Charts page and drag it on top of another chart block. Both chart images will be replaced by a new Collection block listing the names of both charts:
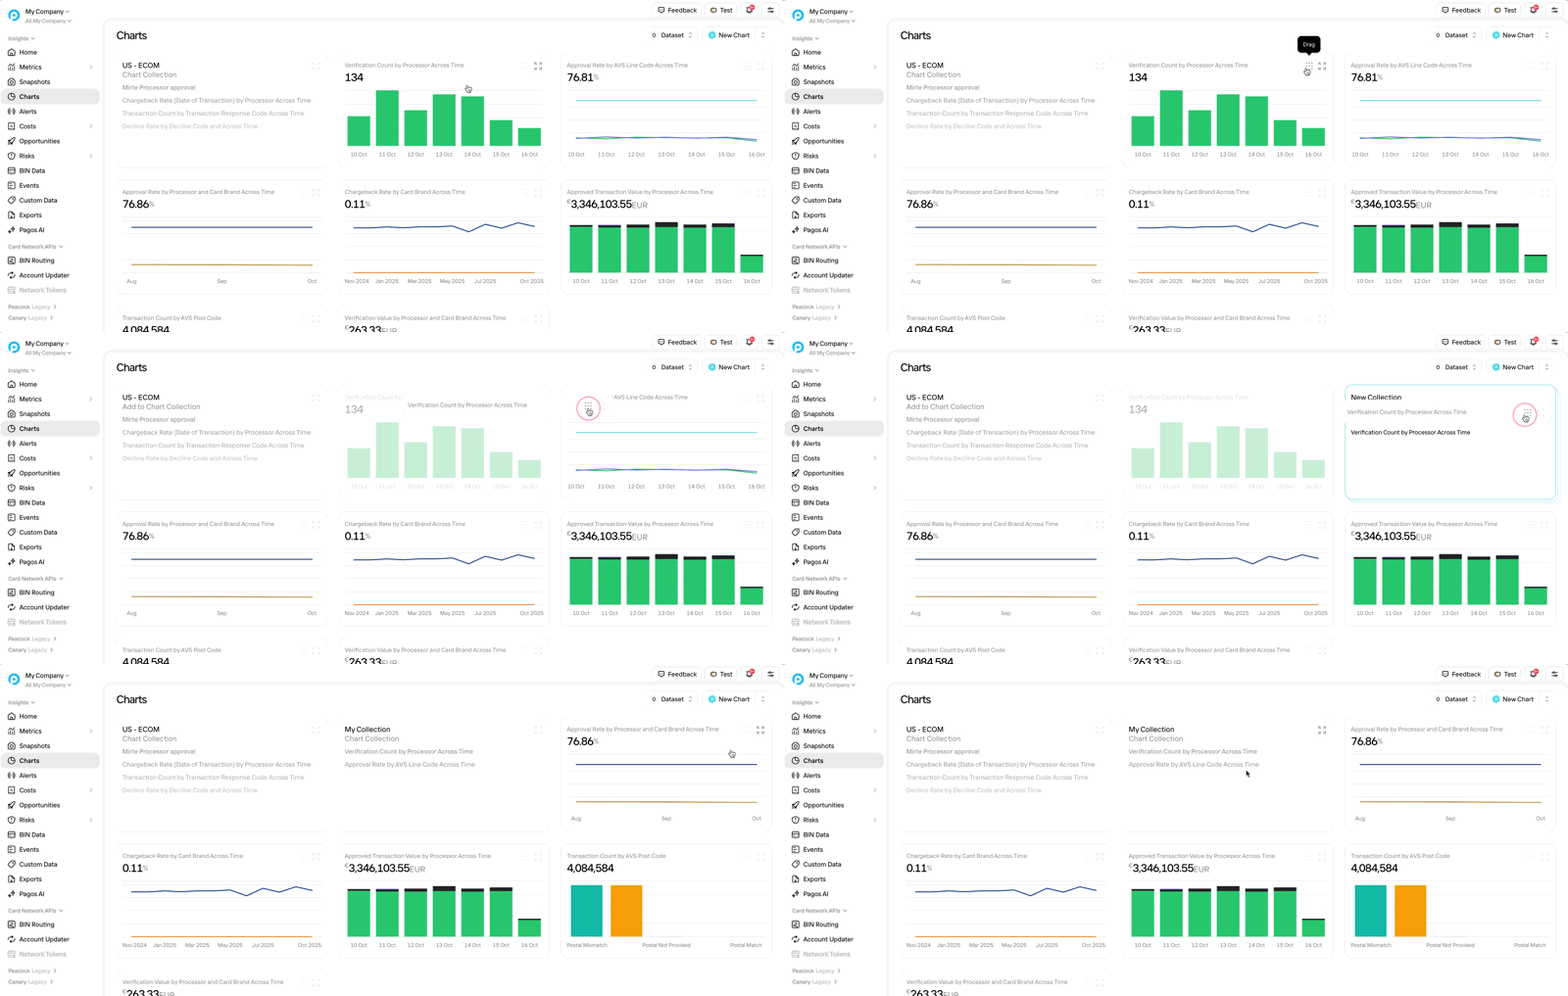 Drag and drop any other charts you want in your Collection.
Click the **expand** icon in the top-right corner of the Collection block. This opens a dashboard of all the charts added to your new Collection.
Use the toggle beside the **New Chart** button to change the Collection's layout from a scrollable dashboard of mid-sized charts to a grid of small charts.
Click the **...** icon beside the Collection's default name ("My Collection"), then click **Rename Collection**. Type the desired name, then click **Save**.
Click **New Chart** to [build a new chart](#creating-new-charts) for your Collection, or click the **arrow** icon to select from the available [chart templates](#templates).
You can use the **search** feature on the Charts landing page to search for individual custom charts or entire Collections.
Drag and drop any other charts you want in your Collection.
Click the **expand** icon in the top-right corner of the Collection block. This opens a dashboard of all the charts added to your new Collection.
Use the toggle beside the **New Chart** button to change the Collection's layout from a scrollable dashboard of mid-sized charts to a grid of small charts.
Click the **...** icon beside the Collection's default name ("My Collection"), then click **Rename Collection**. Type the desired name, then click **Save**.
Click **New Chart** to [build a new chart](#creating-new-charts) for your Collection, or click the **arrow** icon to select from the available [chart templates](#templates).
You can use the **search** feature on the Charts landing page to search for individual custom charts or entire Collections.