> ## Documentation Index
> Fetch the complete documentation index at: https://docs.pagos.ai/llms.txt
> Use this file to discover all available pages before exploring further.
# Changelog
> Latest updates and improvements to the Pagos products
## Alerts
[Hourly alerts](/insights/alerts/alerts-overview#hourly-alerts-beta) on approval rate and attempted transaction count are now in Beta. Reach out to your Pagos Account Manager to request access.
## Alerts
You can now [subscribe](/insights/alerts/alerts-overview#subscribing-to-custom-segment-alerts) to receive alert notifications for a custom segment made by another user within your Pagos Organization.
## Retry Performance
The new [Retry Performance](/insights/retry-performance) dashboard is now in Beta. Learn more in [the Pagos Blog](https://pagos.ai/blog/introducing-pagos-retry-performance). Contact your Pagos Account Manager if you want to be included in the Beta.
## Costs
When you download **Aggregated Data** from the [Costs](/insights/costs) section of the Pagos Service Panel, your downloaded file will now appear in the **Exports** page once it's ready.
## Opportunities
We updated the [Network Tokenization](/insights/opportunities#network-tokenization) tab in the **Opportunities** page to account for the reduced savings Visa now offers for tokenized consumer credit transactions processed in the US. With the release of DCAP, the interchange savings given to eligbile transactions processed with network tokens decreased from 10bps to 5bps. Additional savings are available on transactions for which you pass specific customer and device data, but these potential savings aren't included in the Opportunities page. For more information about DCAP, see [the Pagos blog](https://pagos.ai/blog/what-visa-s-new-dcap-program-means-for-merchants).
## BIN Benchmark
We launched a new widget on the Home page of the Pagos Service Panel called [BIN Benchmark](/insights/home#bin-benchmark). Updated every Wednesday, BIN Benchmark has two sections:
* **Below Your Recent Average** - Identifies which of your BINS are performing below established trends in your own payments data
* **Below Benchmark** - Identifies BINs in MIT and CIT categories where your approval rate falls below the Pagos network benchmark
Learn more about this tool in the [Pagos blog](https://pagos.ai/blog/introducing-bin-benchmarking-a-weekly-shortlist-of-the-bins-requiring-your-attention).
## Events
You can now customize the table columns in the [Events](/insights/events) page of the Pagos Service Panel.
## Charts
We added the following [Dimension options](/insights/charts#dimensions) to Charts:
* Durbin Regulated
* Card Product Category
## Charts
We've added a new [Metric](/insights/charts#metrics) to Charts: Chargeback Win Rate.
## Charts
We've added a new [Metric](/insights/charts#metrics) to Charts: Per-Transaction Fees. This option is only available data ingested from Adyen, Braintree, dLocal, PayPal, and Stripe.
## Pagos AI
Pagos AI now remembers a high-level summary of past conversations! Learn more in the [Pagos AI FAQ](/insights/pagos-ai-faq#does-pagos-ai-remember-previous-conversations).
## Charts
We've changed the default layout for chart [Collections](/insights/charts#collections) to a scrollable list of mid-sized charts. Use the layout toggle to switch to a grid of smaller charts.
## Alerts
We added an [Alerts widget](/insights/home#alerts-summary) to the Home page. Here you'll find a list of all payments data anomalies Pagos AI flagged in the last seven days. Click on any alert to navigate to the associated **Alerts Metric Details** page where you can learn more.
## Smaller Updates
* **Date Range Filter** - When you select a custom date range using the [date range filter](/insights/insights-data-filters#date-range), the selected dates will appear directly on the filter's drop-down menu. This ensures you can tell at a glance what time period you're looking at data for.
* **Cost: Invoices Page** - The [Dimensions drop-down menu](/insights/costs#dimensions-drop-down-menu) on the Invoices page in the Cost section of Pagos Insights now includes **Fee Type** as a breakdown option.
## Processor Data Connections
You can now connect to Stripe via an OAuth connection method. Learn more in the [Connect to Stripe](/importing-data/connecting-payment-processors/connect-to-stripe) guide.
## Opportunities
You can now export the data in a tab of the [Opportunities](/insights/opportunities) page. This downloads all data on the selected tab to a CSV.
## Cost Health
We added a [Cost Health](/insights/home#cost-health) widget to the Home page. It surfaces two types of fee alerts:
* **Fee Increases** - Any anomalous month-over-month cost spikes by fee subcategory and processor (updated once a month)
* **New Fees** - New fee types that have appeared in the last 30 days
## Alerts
When you click the **Focus** icon for an Alerting Segment or Monitored Segment on the Alerts Metric Details page, we now show the segment filters at the top of the focus graph. This clarifies what data we've filtered for in the visualization.
## Data Filters
We added a new text field data filter to [Charts](/insights/charts) and the [Fees](/insights/costs#fees) dashboards called **Fee Description**. Use the text field to enter a specific raw fee name as it appears in your processor data. The field uses *contains* logic, meaning we'll filter for all raw fee names containing the text you enter. Apply the filter, then export your **Aggregated Data**; the **Fee Descriptions** column identifies the exact raw fee names you filtered for.
## BIN UI
We moved some BIN-related content around the Pagos Service Panel. There are now two pages in the main navigation related to BINs:
* **[BIN Insights](/insights/bin-insights)** - Identify the top BINs in your transaction, approval, decline, chargeback, refund, and verification data.
* **[BIN](/card-network-apis/bin)** - Located in the **Card Network APIs** section of the main nav, this page contains three tabs:
* **Lookup** - Manually perform BIN lookups and see the response in plain text
* **BIN API** - Monitor your usage of the BIN Data API
* **Batch** - Download BIN Data Batch files
## Insights Home
Your favorite [Charts](/insights/charts) now appear on the Home page when you first log into Insights.
## Custom Data Descriptions
You can now add descriptions to your metadata in the [Custom Data](/insights/custom-data#descriptions) section of Insights. Navigate to the **Descriptions** tab to add descriptions, providing additional context on what each field represents. Every Pagos user in your Organization will see the same metadata descriptions in the Descriptions and Metdata tabs, as well as in the metadata filter.
## Charts
Click the **star** icon next to a Chart or Collection in the main [Charts](/insights/charts#editing-existing-charts) page to favorite it and bring it to the top of the page.
## Pagos AI
Pagos AI is no longer in Beta, and is now available for all Pagos users. Learn more in our [Explore Pagos AI](insights/explore-pagos-ai) guide.
## Opportunities
There's a new tab in the **Opportunities** section of Pagos Insights: [Visa CEDP Calculator](/insights/opportunities#visa-cedp-calculator). In this new tab, you can estimate your CEDP participation rate and data quality rate, and we'll calculate the CEDP savings (or costs) you can expect should you pass enhanced data with qualifying Visa transactions.
As a part of this launch, we also changed the **Enhanced Data** Opportunities tab to **Mastercard Enhanced Data**. Here you'll find your L2/L3 savings opportunities for qualifying Mastercard transactions.
## Pagos AI Beta
We've released a new Beta version of Pagos AI. Learn more in our [Explore Pagos AI](insights/explore-pagos-ai) guide.
## Charts
You can now easily [edit the name and description of a custom chart](/insights/charts#editing-existing-charts): navigate to the chart in question, click the name or description, make your edits, then hit **enter**.
## Events
The [event details page](/insights/events#event-details-page) for an individual transaction event (e.g. transaction, refund, chargeback, or dispute) now includes the status of that event.
## Charts
We added a **Compare to Previous Period** toggle to custom charts created in the [Charts](/insights/charts) section of Pagos Insights. This toggle is only accessible on charts with the **Across Time** View that do **not** have a secondary breakdown dimension.
## Events
You can now use **Order ID** to search for individual transaction events in the [Events](/insights/events) section of Insights.
## Charts
We've added a new option in the [**Dataset** menu](/insights/charts#deduplicate) on individal charts in the **Charts** section of the Pagos Service Panel: **Apply to this Chart Only**.
When toggled on, your selected dataset settings (**Deduplicate** and **Pending Transactions**) will save to the custom chart and remain in place even when you make dataset changes elsewhere in the UI. When toggled off, your dataset selections won't save.
# Alerts
If you select to receive [Alert notifications](/getting-started/managing-your-pagos-account#notifications) via email, you'll only receive up to one email per day containing all anomaly alerts from the previous day.
## Charts
You can now search for individual charts or entire Collections from the Charts landing page. Click the **search** icon, then type the name of a chart or Collection in the search bar.
## Charts
When creating a custom chart with [**Verification Approval Rate**](/insights/charts#verification-approval-rate) as the chosen **Metric**, you'll now see a toggle for **View Verification Count**. Clicking this toggle adds your attempted verification count to the graph, providing you context for the corresponding verification approval rate.
## Filters
We've added two new filters to Insights: [Fee Type](/insights/insights-data-filters#fee-type) and [Fee Category](/insights/insights-data-filters#fee-category). You can apply these filters to each page under the [Costs](/insights/costs) section of Insights and custom [Charts](/insights/charts) built around fee metrics.
## Options
The **Options** drop-down menu that appears on **Metrics** pages and individual custom [Charts](/insights/charts#options) now contains a new toggle: **Show Trend Line**. Click this toggle to add a line to the data visualization demonstrating a statistical trend over the selected date range. Keep in mind the following limitations:
* The Trend Line option is only available for charts demonstrating your data across time.
* It doesn’t appear in rate charts when the associated count toggle is on or in charts with a secondary Breakdown.
* Trend lines exclude the most recent time interval (e.g. this week when viewing a weekly date range, or the last two days for daily intervals), as your data for that time is still coming in and could skew the trend.
## Charts
You can now [duplicate existing custom Charts](/insights/charts#editing-existing-charts). To do so, click the **...** icon beside the **View** drop-down menu, then click **Duplicate Chart**. You can then make edits to the duplicate chart to customize it to your needs.
## Charts
We've added a new **Metric** in Charts: [Fee Amount](/insights/charts#fee-amount). You can now create custom visualizations for the total fee amount your company faces in a given period of time. Additionally, you can now break down fee-based charts by the following **Dimensions**:
* Fee Type
* Fee Category
* Settlement Currency
## Legacy Canary
You can no longer create new triggers in Legacy Canary. For automated data monitoring and anomaly alerting, check out [Alerts](insights/alerts/alerts-overview).
## BIN Data
The table in the **Data** tab of your [BIN Data](/insights/bin-data#data) page is now sortable! Click a column header to sort the table by that column's data in descending order; click the header again to sort in ascending order.
## Alerts - Decline Rate
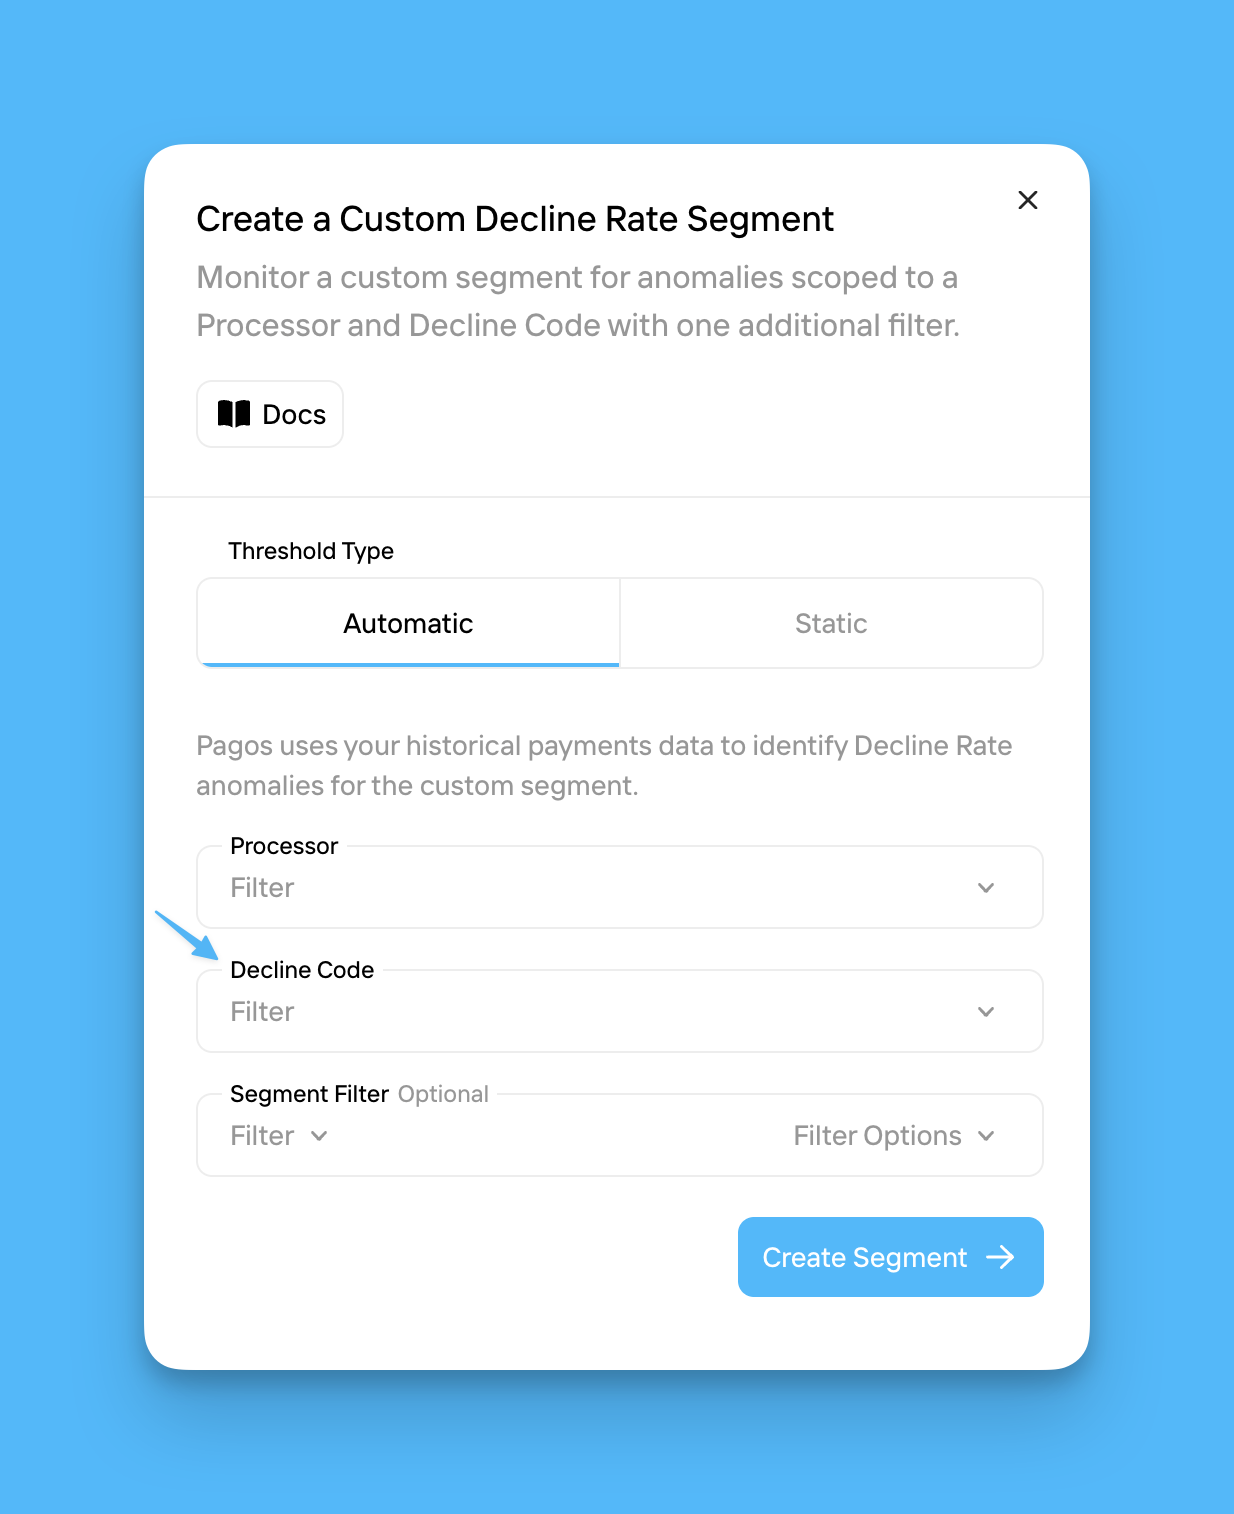
When creating a [custom segment in Alerts](insights/alerts/alerts-overview#custom-segments) for the Decline Rate metric, you must select a specific decline code to monitor.
## Charts
When you create a custom visualization in [Charts](/insights/charts) for a rate metric (e.g. approval, decline, chargeback, dispute, or refund rate), you'll now have a new toggle option: **View \[event] count**. Click this toggle to add count to the chart alongside the rate measurements across time. For example, if you make a chart with the Metric set to **Refund Rate**, a **View Refund Count** toggle appears in the top-right corner of the visual; click the toggle to add refund counts as bars to the refund rate line graph.
## Events
We added a new tab to [Events](/insights/events): Verifications. You can now view the individual verifications in your payments data. Click a verification in the table to view additional details about the payment method, processor, and more.
## Charts
When applying a filter to a custom visualization in [Charts](/insights/charts), you can now select **All** in the parameters list for most filters. This enables you to quickly filter for all parameters except a select few (i.e. select **All** then deselect the parameters you wish to exclude). The only [filter options](/insights/insights-data-filters#filter-options) that don't have an **All** option are BIN, Issuing Bank, Metadata, and Soft Descriptor.
## Alerts
You can now create **custom segments in Alerts**. Define the exact market segments you want Pagos to monitor for anomalies, and even set static thresholds for each metric. Whenever that metric crosses the threshold for your defined segment, Pagos will notify you of the change. Learn more in the [Alerts](insights/alerts/alerts-overview#custom-segments) guide.
## Chart Collections
In the **Charts** section of Insights, you can now create full dashboards of custom data visualizations called **Collections**. To create a new Collection, drag and drop one chart onto another in the main Charts page. Rename the Collection to indicate who created it or the purpose it was created for. Learn more in the [Charts](/insights/charts) guide.
## Events
We added a new field to the **Additional Data** section on the [Event Details page](/insights/events#event-details-page): Soft Descriptor.
## BIN Data
We removed the 500 row limit on exports from the [Data](/insights/bin-data#data) tab of BIN Data.
## Events
* We added more [filter options](/insights/insights-data-filters#filter-options) to each tab in the [Events](/insights/events) section of Insights.
* The **Transaction Details** section on the [Event Details page](/insights/events#event-details-page) now includes **Network Advice**
* Network Advice is guidance from card networks like Mastercard that helps merchants understand why a transaction was declined and how to respond. These actionable codes, such as *Do not try again (7903)* or *Retry after 24 hours*, enable merchants to make informed decisions about transaction retries, customer communication, or blocking specific users.
At this time, we only receive Network Advice data from Adyen and Braintree.
## BIN Data
In the [Data](/insights/bin-data#data) tab of BIN Data, we added more [filter options](/insights/insights-data-filters#filter-options) for the BIN data tables.
## Charts
* We added two new [dimensions](/insights/charts#transaction): **Network Advice**. Use this option to break down your chosen metric by the advice a card network provided on how to proceed.
* When you select a chargeback metric, you can now break your data down by the dimension of [Network Token](/insights/charts#payment-method)
## Insights Updates
* [Charts](/insights/charts) - When you use the **By share** [view option](/insights/charts#views) to create a pie chart, the hover-over key now includes percentages
* Your [account currency](/getting-started/managing-your-pagos-account#managing-your-pagos-user-account) - We've added the Swiss Franc (CHF) as a currency option in your account settings
## Charts
* We expanded the number of [metric options](/insights/charts#metrics) you can break down by the [dimensions](/insights/charts#dimensions) of **BIN** and **Issuer Bank**. You can select either dimension for all metrics except Chargeback AOV, Dispute Rate/Count/Value, and cost-related metrics.
* We added **Soft Descriptor** as a [filter option](/insights/insights-data-filters#filter-options) in Charts.
## BIN FAQs
We've added a new section to the Pagos Product Documentation: [BIN Database](/bin-database/getting-started-with-bin-database). This section contains all content relevant to our BIN Database products, including BIN lookups and batch downloads via the Pagos Service Panel, the BIN Data API, and the BIN Data Batch API. We've also added a set of FAQ pages:
* [BIN Data General FAQ](/bin-database/general-faq)
* [BIN Data: Card Networks and Issuers FAQ](/bin-database/card-network-faq)
* [BIN Data: Card Types and Flags FAQ](/bin-database/card-type-flags-faq)
* [BIN Data: Network Token Support FAQ](/bin-database/network-tokens-faq)
* [BIN Data Integration FAQ](/bin-database/data-integration-faq)
## VAMP Data for Chase
We now receive TC40 data from Chase! If you import payments data from Chase, you'll now see TC40 data in your [Visa Formula](/insights/metrics/chargebacks#visa-chargeback-formula-and-vamp-data) breakdown on the Chargebacks Metrics page.
## Unified API Keys
The Pagos platform now uses a single, unified API key to authenticate requests to all our services. Check out our new [Pagos API Authentication](/authentication/authentication-overview) guide for full instructions on generating your own unified API key.
## New Charts Dimensions
You can now select **BIN** and **Issuer Bank** as dimensions in [Charts](/insights/charts). Select these options to create custom tables demonstrating your chosen metric broken down by the top 25 BINs or Issuers.
## Fee Data at the Transaction Level
The [Event Details page](/insights/events#event-details-page) for individual transactions now includes a **Costs & Fees** section. Here you'll find all transaction-level fee information for a given event.
## Fee Data in Charts
We've added more options to Charts for viewing and filtering by fee information:
* New [metrics](/insights/charts#interchange-effective-rate) - **Interchange Effective Rate** or **Interchange Amount**
* New [dimension](/insights/charts#fees) - **Fee Currency**
* New filter option - **Fee Currency**
## Effective Rate Breakdown
In the [Effective Rate](/insights/costs#effective-rate) page under **Costs**, you can now click a row in the table to view a breakdown of the fee and sale amounts used to calculate your effective rate.
## Amex Effective Rate
The [Effective Rate](/insights/costs#effective-rate) page under **Costs** now includes data ingested from [Amex](/importing-data/connecting-payment-processors/connect-to-amex) data connections.
## Chargeback Metrics: VAMP
When you select the [Visa formula](/insights/metrics/chargebacks#visa-formula) for calculating chargeback rate in the **Chargebacks** Metrics page, we'll now display your data broken down by the **Fraud Notification (TC40)** vs. **Chargeback (TC15)** contributions to your chargeback volume. This additional granularity helps you better understand how Visa assesses your fraud exposure under new [VAMP](/insights/metrics/chargebacks#vamp-overview) regulations.
## Alerts Update
We've added a new Alert metric: [Refund Count](insights/alerts/alerts-overview#refund-count). You'll now see alerts on days when the number of refunds for a segment of your transaction volume increases unexpectedly.
## Charts Update
When you create a custom Chart with a refund or chargeback [Metric](/insights/charts#metrics), there's a new [Option](/insights/charts#options) for manipulating the data by **Original Transaction Date**. Use this toggle to change the chart from showing chargebacks/refunds from the selected date range to showing chargebacks/refunds issued against transactions *originally processed* in that date range.
## Insights Updates
We've added more options for navigating around the Insights platform to take your data analyses to the next level:
* From [Metrics](/insights/metrics/overview#open-with), export to **Charts** to dig in further or [**Events**](/insights/events) to see the exact transaction events behind your visualizations
* From [Charts](/insights/charts), export to **Events**
* From [Snapshots](/insights/snapshots#open-with), export to **Charts** or **Events**
* From [Alerts](insights/alerts/alerts-overview#export-options), export to **Metrics**, **Charts**, or **Events** to learn more about your data anomaly
## Alerts Timing: Chase Data Connections
We’ve updated our [Alerts evaluation time](insights/alerts/alerts-overview#alert-timing) for Chase: it now runs with a two day delay instead of one day. This change is to prevent unnecessary alerts, as Chase sometimes sends data out of order.
## Alerts Update
We’ve added BIN as a segmentation parameter in [Alert monitoring](insights/alerts/alerts-overview#monitored-segments). Pagos will track attempted transaction counts per BIN and notify you if any one shows a spike inconsistent with its historical patterns. Keep in mind, Alerts accounts for historical fluctuations and seasonality when identifying anomalies, so you only get notified when something truly stands out.
## Chargeback/Dispute Dataset Options
By default, visualizations of chargeback and dispute data typically exclude chargebacks/disputes that result in Rapid Dispute Resolution or have the following [status categories](/response-codes/chargebacks/chargeback-status-codes): *cancelled*, *RFI*, *pre-arbitration*, *pre-dispute*, *notification\_of\_fraud*, and *pre-compliance*. You can now add these chargebacks/disputes back in using the new **All Chargeback & Dispute Statuses** toggle in the **Dataset** drop-down on the following pages of your Pagos Service Panel:
* [Disputes](/insights/metrics/disputes#all-chargeback-statuses) and [Chargebacks](/insights/metrics/chargebacks#all-chargeback-statuses) Metrics Pages
* [Snapshots](/insights/snapshots#all-chargeback-statuses)
* [Charts](/insights/charts#all-chargeback-statuses)
Additionally, when you make a custom Chart for a chargeback or dispute metric, you'll have a new [Dimensions](/insights/charts#dimensions) option: **Rapid Dispute Resolution**. This dimension breaks down your data by whether or not the transaction was resolved by Visa as Rapid Dispute Resolution.
## Network Tokenization
Our Network Tokenization UI has moved into the Pagos Service Panel. All Toucan subscribers can now access their accounts via [https://secure.pagos.ai/sign-in](https://secure.pagos.ai/sign-in). All documentation has been updated to match the new UI:
* [Network Tokens](/card-network-apis/network-tokens)
* [Network Tokenization API Overview](/network-tokenization/overview)
## Pagos Copilot in Metrics
You can now request a data analysis from Pagos Copilot on any Metrics page. Navigate to the desired page and metric, then click **Analyze Data** to generate a data summary and suggested next steps. Learn more in our [Metrics Overview](/insights/metrics/overview#pagos-copilot-analysis) guide.
## Pagos MCP Server
We've released our first MCP Server. This server allows AI agents and applications to query the payments intelligence available through Pagos. Once connected, you can use AI agents to query data from our BIN Database for a given BIN number. Learn more in [Getting Started With the Pagos MCP Server](/mcp/getting-started-with-pagos-mcp-server) or check out our [Press Release](https://www.prnewswire.com/news-releases/pagos-launches-first-mcp-server-to-bring-payments-intelligence-to-ai-agents-302478266.html) on this launch!
## Parrot Batch UI
BIN Data Batch subscribers can now download the latest Standard and Enhanced BIN data files directly from the [Batch](/insights/bin-data#batch) tab in the BIN Data section of your Pagos Service Panel.
## BIN Data UI Changes
We made small changes to the [BIN Data UI](/insights/bin-data). You now navigate between the different BIN Data pages using tabs at the top of your Pagos Service Panel (not in the main navigation). All other functionality remains the same.
## Changelog Notifications
We've added a new type of [notification](/getting-started/managing-your-pagos-account#notifications) available in the Pagos Service Panel, via email, or via Slack: Changelog notifications. Once a month, we'll notify users of updates to the changelog from the last month; click the notification to navigate to the Pagos Changelog and learn more.
## Updated L2/L3 Opportunity Breakdown
We’ve improved the way we display [Enhanced Data savings opportunities](/insights/opportunities#enhanced-data) to provide a more accurate estimate of potential savings. Previously, transactions eligible for both Level 2 and Level 3 processing were grouped together as L3-eligible. Since Level 3 often offers greater fee reductions, this could lead to overestimated savings.
To address this, we now break down transactions into three distinct categories:
* Eligible only for Level 2
* Eligible for both Level 2 and Level 3
* Eligible only for Level 3
Each category shows its own estimated savings percentage, helping customers better understand the true value of applying higher data levels.
## Metrics to Charts
We've introduced a method for navigating seamlessly between Metrics and Charts. After you identify an interesting segment of data using the filter or focus features in Metrics, click **Export**, then click **Charts** to navigate to a custom chart containing the same data segment. Learn more in our [Metrics](/insights/metrics/overview#open-with) guide.
## Notifications
We've added notification capabilities to the Pagos Service Panel! You can now receive notifications in the dashboard, via email, or in a designated Slack channel whenever you receive an [alert](insights/alerts/alerts-overview) or an [data export](/insights/data-exports) is ready for download (Puffin only). Learn more in our [Managing Your Pagos Account](/getting-started/managing-your-pagos-account#notifications) guide.
## Account Updater
Our Account Updater UI has moved into the Pagos Service Panel. All Loon subscribers can now access their accounts via [https://secure.pagos.ai/sign-in](https://secure.pagos.ai/sign-in). All documentation has been updated to match the new UI:
* [Account Updater](/card-network-apis/account-updater)
* [Batch Account Updater API Overview](/account-updater/batch-api-overview)
* [Real-Time Account Updater API Overview](/account-updater/real-time-api-overview)
## Events Update
Last month, we launched **Events**, which provides access to a unified view of every transaction you processed, harmoinzed across your processors. We've just added three more tabs to this section, displaying the exact transactions behind card **Chargebacks**, non-card **Disputes**, and **Refunds**. Learn more in the [Events](/insights/events) guide.
## Opportunities Update
We've improved the **Opportunities** section of Insights! Now, instead of demonstrating the total transaction amount for which cost saving opportunities exist, this section estimates the exact savings amount available. With this update, you now see the dollar amount you could save, estimated based on historical cost data and how often these optimizations are typically applied across similar transactions. This gives you a clearer, more realistic picture of your optimization potential.
You’ll also notice a confidence score on each opportunity. That reflects how much visibility we have into your data. For example, we can reliably estimate savings from tokenization with 90% confidence. We have less visibility into how often L2/L3 data or debit routing are actually used, so those estimates are a bit more directional.
It’s also important to note that not all benefits are cost-related: network tokenization and debit routing may still increase your approval rates, even if they don’t reduce fees in every case.
### How We Estimate Opportunity Savings
Your Opportunities dashboard shows where you could reduce processing costs based on the way transactions are routed and enriched. Each savings estimate is calculated based on:
* Which transactions qualify (eligibility)
* What the potential cost savings would be, based on real historical data and official network rates
The goal is to give you a grounded, directional estimate of what you could actually save. We’ve modeled these calculations by analyzing 13+ months of transaction cost data across processors and geographies, and comparing them against published interchange documentation from Visa and Mastercard.
### Network Tokenization
We look at eligible transactions (based on issuer country, card brand, funding type, and merchant processor) and apply the expected savings rate. These savings are sourced from both historical cost data and official Visa/Mastercard documentation. Since not all markets have clear cost savings, estimates are currently limited to the United States, Australia, and Japan.
For example, in the United States:
* Visa Consumer Credit cards see 0.10% savings
* Mastercard payment cards and other Visa cards see no additional cost savings
* Only domestic transactions where the merchant and issuer are both US-based experience savings
### Enhanced Data
We identify transactions that could qualify for Level 2 or Level 3 data enhancements based on the card network and BIN of the associated payment card. From historical cost data, we’ve observed:
* L2 saves \~0.55%
* L3 saves \~0.95%
* Combined average cost savings: \~0.60%
We use these benchmarks to calculate potential savings on your eligible volume. Since we can’t always see whether L2/L3 data was actually applied, this estimate assumes typical usage patterns from comparable merchants.
### Debit Routing
Eligible transactions include Visa and Mastercard debit/prepaid cards issued in the US. We estimate savings by applying average rates from historical interchange reports:
* Regulated debit: \~0.06% savings
* Unregulated debit: \~0.46% savings
Savings are calculated based on the assumption that many merchants are only partially routing eligible volume to alternative debit networks—a pattern we’ve seen consistently in the data. Your estimate reflects the remaining opportunity, not what you’ve already captured.
### Why This Matters
We know the differences between eligible volume and actual savings can be confusing — especially if you were used to seeing just volume in Opportunities (pre-04/07/2025). These new estimates bring you closer to the real impact of each optimization.
While some opportunities (like tokenization or routing) also bring benefits like improved approval rates, we’ve focused here only on measurable cost savings. Approval benefits are something we’re actively working on surfacing in future versions.
For more information, check out the [Opportunities](/insights/opportunities) guide!
## Alerts Update
We've added a new Alert metric: [Decline Code Rate](insights/alerts/alerts-overview#decline-code-rate). You'll now see alerts on days when the ratio of total attempted transactions declined with a specific decline code increases unexpectedly.
## New Fee Filtering
We've added an **Only New Fees** toggle to the **Fees by Category**, **Fees by Subcategory**, and **Interchange & Assessments** pages within the Costs section of Insights. Use this toggle to filter the entire page to only show data for the newest fees you've faced. Learn more in our [Costs](/insights/costs#new-fee-filtering) guide.
## Events
We've added a new section to the Pagos Service Panel titled [Events](/insights/events). You now have access to a unified view of every transaction—across every processor—fully harmonized and organized in one place. Take your payments analysis to the next level by digging down to the transaction-level.
## Alerts Update
Alerts are now available for all processor connections, including file-based connections like those through JP Morgan Chase or WorldPay Vantiv. See our [documentation](insights/alerts/alerts-overview) for information on alert timing for different connection types.
## Snapshots
We've added a new section to Insights titled [**Snapshots**](/insights/snapshots). Here, you'll find a customizable dashboard of payments data visualizations, with a variety of charts under the following categories:
* Approvals & Transactions
* Declines
* Payment Methods
* Cards
* Chargebacks
* Issuers
* Subscription & Stored Credentials
* 3D Secure
* Advanced Authentication
* Refunds
## Alerts
We've added another payments metric to the [Alerts](insights/alerts/alerts-overview) page: Chargeback Count. Pagos will now automatically monitor your total count of card-based disputes and alert you of anomalies.
## Alerts
We've released a new section in the Pagos Service Panel called **Observability**. In this new section, you'll find **Alerts**.
**Alerts** offers you a daily health check for your payment processing strategy—no manual setup required! Identify at a glance when your business has experienced unexpected and abnormal changes to key payment metrics like approval rate and attempted transaction count.
Check out our [Alerts](insights/alerts/alerts-overview) guide for more information!
## Charts
In the [Charts](/insights/charts) section of Pagos Insights, you can now build custom charts demonstrating the following verification metrics:
* **Verification Rate** - The percentage of total verification attempts that succeeded in a given time period; calculated by dividing the total number of approved verifications by the total number of attempted verifications
* **Verification Count** - The total number of attempted verifications processed in a given time period
* **Verification Value** - The total combined value of all attempted verifications processed in a given time period
## Penalties
The [Penalties](/insights/costs#/penalties) page under the **Costs** section of Insights now includes data imported from Adyen. This page now displays your data for all of the following connected processors:
* Adyen
* Braintree
* Chase
* Stripe
* Worldpay
As of December 6, 2024, we've introduced a significant change to our UI, namely moving Parrot, Peacock, Canary, Flamingo, and Puffin into a single interface: the [Pagos Service Panel](https://secure.pagos.ai/sign-in). Almost all Pagos customers use multiple Pagos products, and as such, we wanted to make it easy to access and use all your subscriptions from a single platform. For any existing Pagos users, all functionality remains the same, but the names and locations of certain products or pages have changed. This involved minor changes to the ways you [manage account details](/getting-started/managing-your-pagos-account) , add [data connections](/importing-data/managing-data-connections), and access your API keys. All documentation on these topics has been updated to match the new UI.
## Peacock Content is now under Insights
Moving forward, Peacock's data aggregation and visualization resources are located in a section of the Pagos Service Panel called **Insights**. This section contains the following content:
* [Metrics](/insights/metrics/overview)
* [Charts](/insights/charts)
* [Opportunities](/insights/opportunities)
* [Risks](/insights/risks)
* [Costs](/insights/costs)
* [Pagos AI](/insights/explore-pagos-ai)
All Pagos merchants who subscribed to Peacock before December 2024 will continue to have access to the following content, now located under a new section in the main navigation called **Peacock Legacy**:
* [Standard Dashboards](/legacy-peacock/standard-dashboards)
* [Custom Dashboards](/legacy-peacock/custom-dashboards)
* Know Your Data
## Parrot Resources are now under BIN Data
Parrot and Parrot Batch resources are now located in a section of the Pagos Service Panel section called **BIN Data**. Here you'll find three pages: Data, Lookup, and API Metrics.
All Peacock subscribers can access the [**Data**](/insights/bin-data#data) page, which provides a detailed breakdown of the top BINs in your payments data. If you're subscribed to Parrot, you can also access the other two pages. From [**Lookup**](/insights/bin-data#lookup) , you can perform BIN lookups without any code or having to use the Pagos BIN Data API.
The [Parrot API](/bin-data-APIs/bin-data-api-overview) continues to function as is without any changes.
## Charts
We’ve added a new section to Peacock called [**Charts**](/insights/charts). With Charts, you can now build out completely customized data visualizations. Monitor and visualize any payment metric, broken down by the dimensions you’re most concerned about, in whatever chart style meets your business needs. Dive deep into the KPIs or customer segments most important to your company, and even save these charts for future use. Check it out:
## Metrics Changes
* We’ve updated the bar lists in the [Metrics](/insights/metrics/overview) pages to show the same metric as the tab's name. For example, the bar lists in the **Approved Transactions** tab of the Approvals page show your approved transaction count broken down by various parameters.
* You can now click **Export** in the top-right corner of the main graph on any Metrics page to download the data behind that graph. If you apply filters or use the focus feature, the downloaded data will reflect these data manipulations.
* **Data Connection** is now available as bar list in Metrics pages (i.e. you can now filter by or focus on data connections).
As of October 25, 2024, we've released a new feature in the [Metrics](/insights/metrics/overview) pages: **Focus**. A **Focus** icon now appears in the top right corner of most bar lists on your Metrics pages. Click the icon to change the main graph at the top of the page to show your data broken down by the parameters of the selected bar list. With Focus, you can now go deeper into your data with a single click!
As of October 18, 2024, we've released two changes to the **Fraud Rules** table in the [Fraud](/insights/risks#fraud) Risks page of the Peacock Service Panel:
* This chart now only displays transactions for which the processor provided fraud rule information. If your processor sends us a fraud score but doesn’t include fraud rule data, we’ll include the associated transaction in the [Transaction Risk Scores](#transaction-risk-scores) graph, but not the Fraud Rules table.
* We’ve added an **Individualize Fraud Rules** toggle. By default, the table groups fraud rules together, displaying the number of transactions flagged by a given set of fraud rules. Click this new toggle to list each rule individually in their own row, along with the total number of transactions flagged by at least that one rule and the average fraud score of those transactions
## New Page: BIN Data
We’ve released an integration of Parrot’s BIN database into Peacock with a new page titled **BIN Data**. Use the tabs at the top of the page—**Transactions**, **Approvals**, **Declines**, and **Verifications**—to view the top BINs you’ve processed in the chosen category. In each tab, the table lists your processed BINs in descending order of the number of transactions (or approvals, declines, or verifications). Each row also contains the issuing country of the associated BIN, approval rate, and total processed value. Click on a row to view a corresponding **BIN Details** page, which lists all the standard and enhanced data points we have in our database for that BIN.
Learn more in our new [BIN Data](/insights/bin-data) guide.
## New Fraud Page
We’ve added another page to the Risks section called [**Fraud**](/insights/risks#fraud). This page is designed to showcase the level of fraud risk your business faces over time and is broken into two visuals:
1. **Transaction Risk Score** graph: Stripe, Adyen, and Braintree automatically generate fraud risk scores to help you evaluate the level of fraud risk associated with each individual transaction you process. This graph breaks down the distribution of your transaction volume over time into six categories of risk score ranges (\<0, 0-25, 25-50, 50-75, 75-100, and 100+).
2. **Fraud Rules** table: See a list of the fraud rules triggered by your processed transaction volume. Each row in the table lists a fraud rule, the processor it's associated with, and the fraud risk score your processor gives transactions flagged by that rule; you can also see the total number of transactions, chargebacks, and refunds processed in the selected time period that were flagged.
## New Penalties Page
We’ve added another page to the Costs section called [**Penalties**](/insights/costs#penalties), which breaks down the penalty fees charged by your processors. The Penalties graph at the top of this page demonstrates your total penalties over time; use the tabs—**Processor**, **Network**, and **MID**—to see your penalty fees broken down across the named dimension.
Beneath the graph, you'll find a **Penalty Breakdown & Guidance** table with a list of the individual penalty fees you've been charged, along with a description of the fee and guidance from Pagos on how to minimize that fee moving forward. At this time, we offer descriptions and guidance for only a portion of the potential penalty fees your business faces; click Export in the top-right of the graph to see a complete breakdown of all your penalty fees by the penalty name.
## Other Changes
In the **Approval Rate** tab of the [Approvals](/insights/metrics/approvals) page, we added a toggle: **View Attempted Transactions**. Clicking this toggle adds your attempted transaction count to the Approval Rate graph, providing you context for the corresponding approval rate. Any [filters](/insights/metrics/overview#filtering-metrics-pages) applied to the page will also impact the attempted transaction counts displayed in the graph.
As of September 5, 2024, we've made a change to the [**Costs**](/insights/costs) section of Peacock. The **Fees** and **Invoices** pages are both broken out into two separate pages:
* **Fees by Category** - View fee data broken down by [Fee Type Category](/response-codes/fees/fee-type-category-codes)
* **Fees by Subcategory** - View fee data broken down by [Fee Type Subcategory](/response-codes/fees/fee-type-subcategory-codes)
* **Invoices by Category** - View invoice data broken down by category
* **Invoices by Subcategory** - View invoice data broken down by subcategory
As of September 3, 2024, we’ve released the following changes to the Peacock Service Panel:
* We added a new no-code data connection: **Worldpay Core**. Contact your Pagos account team if you’re interested in this data connection!
* In the [Declines](/insights/metrics/declines) page under Metrics, we’ve added two new bar lists for viewing your decline data broken down by **Decline Code** and **Decline Category**.